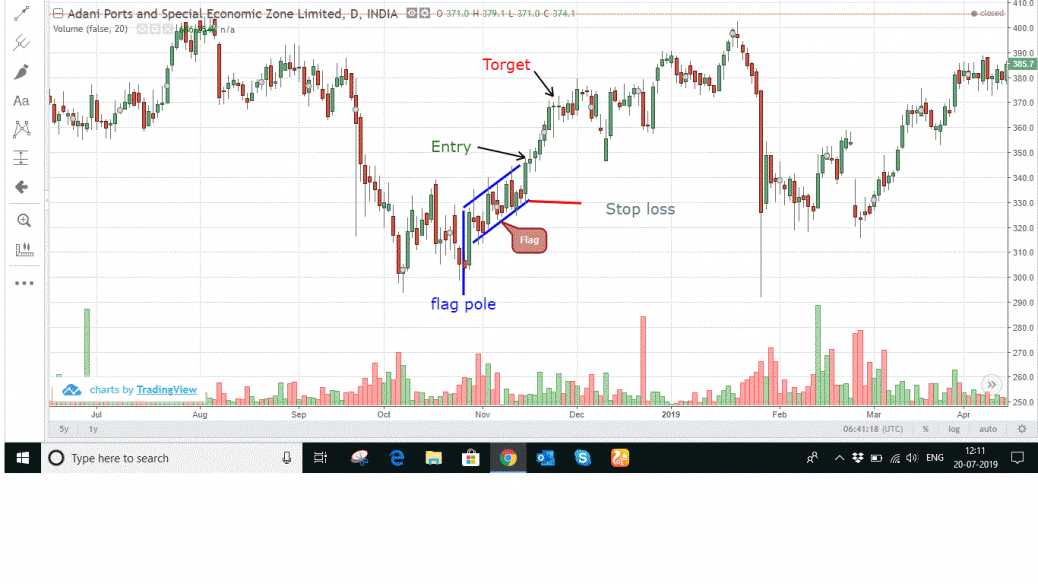
The flag pattern is witnessed at Adani ports during 26 oct 2018.Bullish flag formations are found in stocks with strong up trends. They are called bull flags because the pattern resembles a flag on a pole. The pole is the result of a vertical rise in a stock and the flag results from a period of consolidation.
Here the stop loss i marked is at the bottom end of the rectangular flag and entry point is selected when it breaks out from the flag.
Entry – 347.6
target- 373.2
Stop loss- 328.7


Hi,
conditions not met…
Identifying the flag pattern is an easy job if you have the right trading conditions.
Now is the time to go through the flag chart pattern strategy step-by-step conditions for the bullish flag pattern
A flag pattern forms when the price rallies sharply, then moves sideways. This sideways movement can be considered as flag and volume should be low during the sideway movement meanwhile volume should be high when breaking out.
Don’t consider single day steeper pole
Duration of the sideways movement of the flag cloth is 4-7 days.
Trade Plan-
Your entry should be just above the breakouts of the consolidation
Set a stop loss just below the flag formation
Your target should be based on the height of the flag
Hi naresh,
Thanks for correcting me by giving clear explanation.i should have seen EQSIS youtube video before going into that pattern.Anyway i tried again to identify the correct pattern of both Flag (in TCS) and Head and shoulder(in IBULHSGFIN).
Kindly go through once and tell me if there is any mistake .