
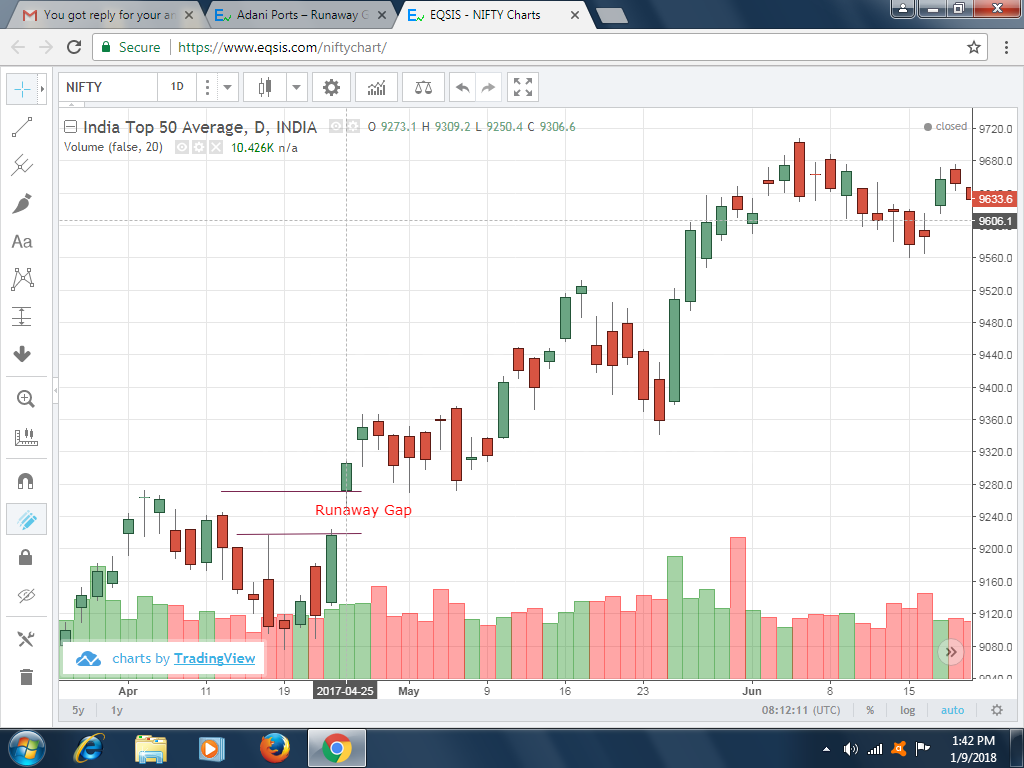
In this Nifty chart a Gap up opening (Runaway Gap) appeared.The Gap appeared inside the area. This Gap was not filled in near term and the close was at its day’s high during Runaway Gap. The Volume is distributed evenly during the day.
feel free to call us +919500077790 info@eqsis.com
In this Nifty chart a Gap up opening (Runaway Gap) appeared.The Gap appeared inside the area. This Gap was not filled in near term and the close was at its day’s high during Runaway Gap. The Volume is distributed evenly during the day.
| M | T | W | T | F | S | S |
|---|---|---|---|---|---|---|
| 1 | 2 | 3 | 4 | 5 | 6 | 7 |
| 8 | 9 | 10 | 11 | 12 | 13 | 14 |
| 15 | 16 | 17 | 18 | 19 | 20 | 21 |
| 22 | 23 | 24 | 25 | 26 | 27 | 28 |
| 29 | 30 | |||||
 Bearish-GAP-SHORT-BICON-25-10-2019 October 25, 2019
 FEDERAL BANK – BEARISH ENGULFING October 17, 2019
 Cummins India – Bearish Engulfing – 24Sep19 September 25, 2019
 Day29-Tata Motors DVR – Bearish Piercing – 12Sep19 September 12, 2019
 Day27-Bearish-Engulfing pattern-Tech Mahindtra-09Sep19 September 10, 2019
Stock Trading is business, the success depends not just on capital or subscribing advisory services or participating workshops. The factors such as your awareness level about business, Efforts and your contributions, Smartness, Knowledge in analysis and trading instrument, availability of infrastructure and emotional control determine your success.
EQSIS, A Stock Market Research Firm
Knowledge is Power. Here you may start from basics, get support while practicing and evolve as active analyst, later you can become a pro


Hi sir,
This is Area gap, If there is a good volume then it can be justified as Breakout gap.
Ok. I will send new one.