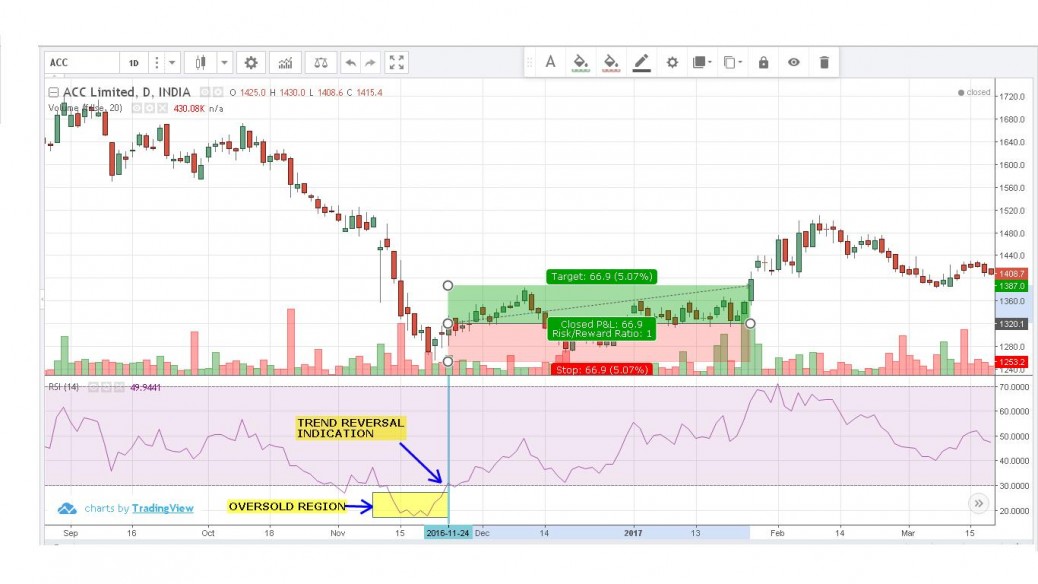
From the chart, it is seen from RSI that the sellers and buyers are exhibiting equal strength for a period and then suddenly, the sellers become more aggressive and push the RSI index of stock price below the 30 mark. The stock price is kept below that level for some time in which the stocks become oversold and the buyers are slowly gaining support. Once the buyers manage to push the index above the 30 mark, that should indicate the aggressiveness of the bulls and a trend reversal is expected. The price is expected to go up further and it is recommended to create a Long position.
ACC – BULLISH – RSI
feel free to call us +919500077790 info@eqsis.com
0 Comments
Stock Analysis
M | T | W | T | F | S | S |
---|---|---|---|---|---|---|
1 | 2 | 3 | 4 | 5 | 6 | 7 |
8 | 9 | 10 | 11 | 12 | 13 | 14 |
15 | 16 | 17 | 18 | 19 | 20 | 21 |
22 | 23 | 24 | 25 | 26 | 27 | 28 |
29 | 30 |
Bullish View
Bearish View
- Bearish-GAP-SHORT-BICON-25-10-2019 October 25, 2019
- FEDERAL BANK – BEARISH ENGULFING October 17, 2019
- Cummins India – Bearish Engulfing – 24Sep19 September 25, 2019
- Day29-Tata Motors DVR – Bearish Piercing – 12Sep19 September 12, 2019
- Day27-Bearish-Engulfing pattern-Tech Mahindtra-09Sep19 September 10, 2019
How this forum help stock traders?
Stock Trading is business, the success depends not just on capital or subscribing advisory services or participating workshops. The factors such as your awareness level about business, Efforts and your contributions, Smartness, Knowledge in analysis and trading instrument, availability of infrastructure and emotional control determine your success.