
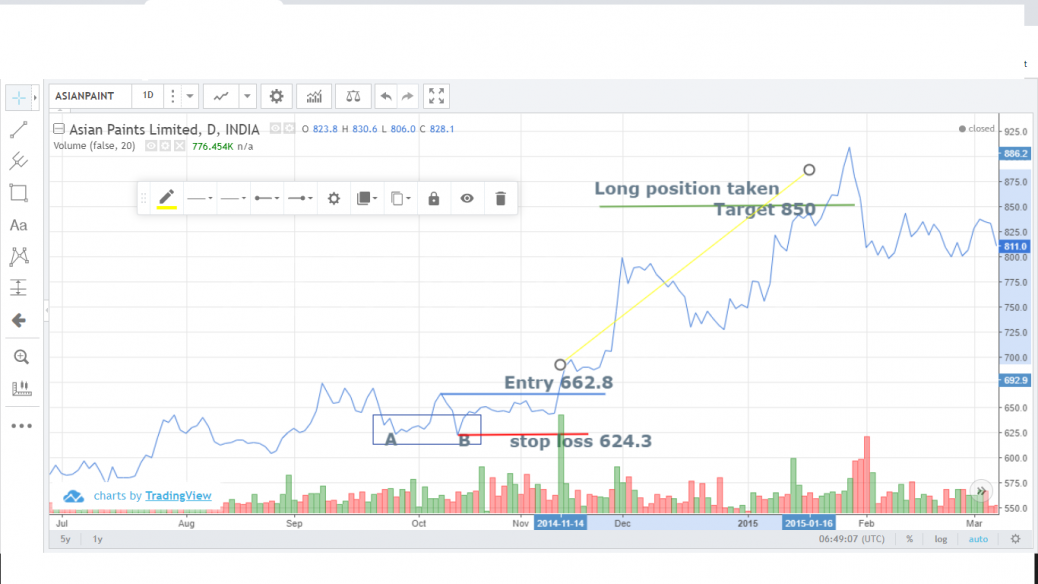
A Double bottom pattern was witnessed in Asian paints on 2014 between sep 25 to oct 16. A long position can be called for as the volume was relatively high on point C. The entry point was taken a bit after crossing point C and a target of 200 min calculated . After this double bottom witnessed the price went very high with good profits enabling for the traders if a long position called for
Entry price 662.8 ; Stop loss 624.3; Target 850


Hi,
The double bottom is a bullish reversal trading pattern that emerges at the end of a bearish trend but here the bottom A has appeared after a sideways movement so it doesn’t qualify for the double bottom pattern. And the duration between the two bottoms should be at least twenty plus candles. It may vary from a few weeks to many months but generally, it takes 1-3 months.
Thank you for the Response. I will check my mistake and submit another analysis on double bottom