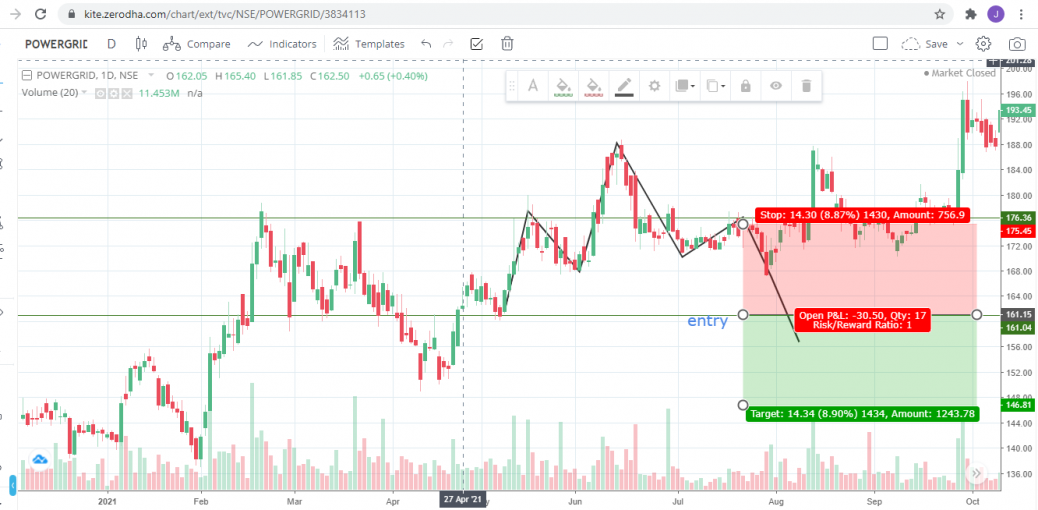
- After long bullish trends, the price rises from 161 to a peak 177 and subsequently declines to 167 form a trough.
- The price rises again to form 167 substantially above the initial peak reached 188 and declines again.The price rises a third time, but only to the level of the first peak 177, before declining once more.the pattern formed in three month duration, consider this as a head and solder pattern if the price break the level 161 it will fall further,
- my trading plan is
- entry :below 161
- target :146
- stop loss ;176
HEAD and shoulder PATTERN @POWER GRID
feel free to call us +919500077790 info@eqsis.com
Stock Analysis
M | T | W | T | F | S | S |
---|---|---|---|---|---|---|
1 | 2 | 3 | 4 | 5 | 6 | 7 |
8 | 9 | 10 | 11 | 12 | 13 | 14 |
15 | 16 | 17 | 18 | 19 | 20 | 21 |
22 | 23 | 24 | 25 | 26 | 27 | 28 |
29 | 30 |
Bullish View
Bearish View
- Bearish-GAP-SHORT-BICON-25-10-2019 October 25, 2019
- FEDERAL BANK – BEARISH ENGULFING October 17, 2019
- Cummins India – Bearish Engulfing – 24Sep19 September 25, 2019
- Day29-Tata Motors DVR – Bearish Piercing – 12Sep19 September 12, 2019
- Day27-Bearish-Engulfing pattern-Tech Mahindtra-09Sep19 September 10, 2019
How this forum help stock traders?
Stock Trading is business, the success depends not just on capital or subscribing advisory services or participating workshops. The factors such as your awareness level about business, Efforts and your contributions, Smartness, Knowledge in analysis and trading instrument, availability of infrastructure and emotional control determine your success.
Hi,
The formation of the Head and Shoulder has been a continuous decrease in volume. That means the volume will be higher in the left shoulder and eventually it decreases with the formation of the head and right shoulder. The main process of the head and shoulder pattern is accumulation and distribution. The duration to form each should be a minimum of 1 month.
Watch the below video…..I hope this will help you
https://www.youtube.com/watch?v=dCuxpo7gp4U