
Relative Strength Index is a Technical Indicator.
It works in the Non Trending Zone. The Index is marked at 30 and 70.
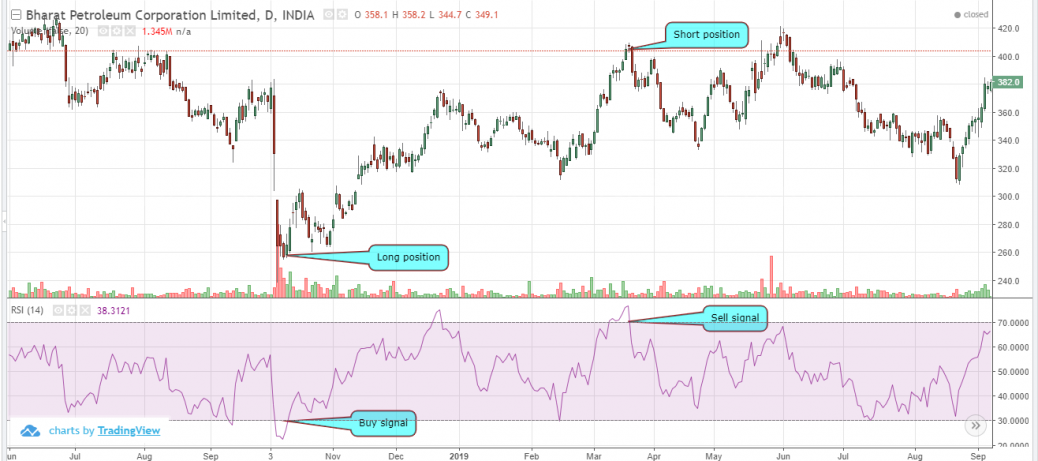
When the graph cut the 70 line from top to it indicates a over bought signal and one can go short.
Similarly when the 30 line in cut from bottom to top it indicates an over sold signal and one can go long.


Excellent work sir…We really appreciate your consistency