
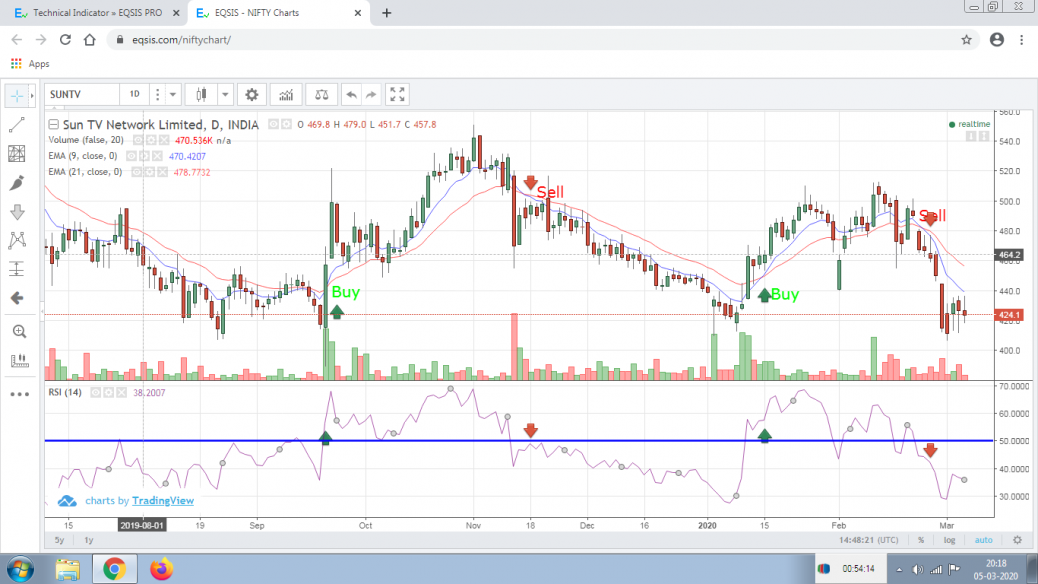
Buy Position
When 9days EMA crossed above 21days EMA, at that time RSI should be cross above 50 Average.
Sell Position
When 9days EMA crossed below 21days EMA, at that time RSI should be cross below 50 Average.
feel free to call us +919500077790 info@eqsis.com
Buy Position
When 9days EMA crossed above 21days EMA, at that time RSI should be cross above 50 Average.
Sell Position
When 9days EMA crossed below 21days EMA, at that time RSI should be cross below 50 Average.
| M | T | W | T | F | S | S |
|---|---|---|---|---|---|---|
| 1 | 2 | 3 | 4 | 5 | 6 | 7 |
| 8 | 9 | 10 | 11 | 12 | 13 | 14 |
| 15 | 16 | 17 | 18 | 19 | 20 | 21 |
| 22 | 23 | 24 | 25 | 26 | 27 | 28 |
| 29 | 30 | |||||
 Bearish-GAP-SHORT-BICON-25-10-2019 October 25, 2019
 FEDERAL BANK – BEARISH ENGULFING October 17, 2019
 Cummins India – Bearish Engulfing – 24Sep19 September 25, 2019
 Day29-Tata Motors DVR – Bearish Piercing – 12Sep19 September 12, 2019
 Day27-Bearish-Engulfing pattern-Tech Mahindtra-09Sep19 September 10, 2019
Stock Trading is business, the success depends not just on capital or subscribing advisory services or participating workshops. The factors such as your awareness level about business, Efforts and your contributions, Smartness, Knowledge in analysis and trading instrument, availability of infrastructure and emotional control determine your success.
EQSIS, A Stock Market Research Firm
Knowledge is Power. Here you may start from basics, get support while practicing and evolve as active analyst, later you can become a pro


Hi,
Good effort!
One of the best ways to use the RSI is by determining whether the stock is overbought or oversold. This method is an easy way to identify buying and selling opportunities in non-trending markets. However, understanding the logic of overbought/oversold can help you better to master this technique.
RSI Bullish Signal
When the RSI falls below 30 it simply indicates the weakness of the stock but do not indicate an oversold scenario. When the stock rises back above the 30 level after a plunge then it can be used as a buy signal.
RSI Bearish Signal
When the RSI rises above 70 it simply indicates the strength of the stock but do not indicate an overbought scenario. When the stock fell below the 70 level after a rise then it can be used for selling short.
If you are interested in learning about the RSI divergence…. Just click on the link below
https://www.youtube.com/watch?v=bIsaSbe4yLU