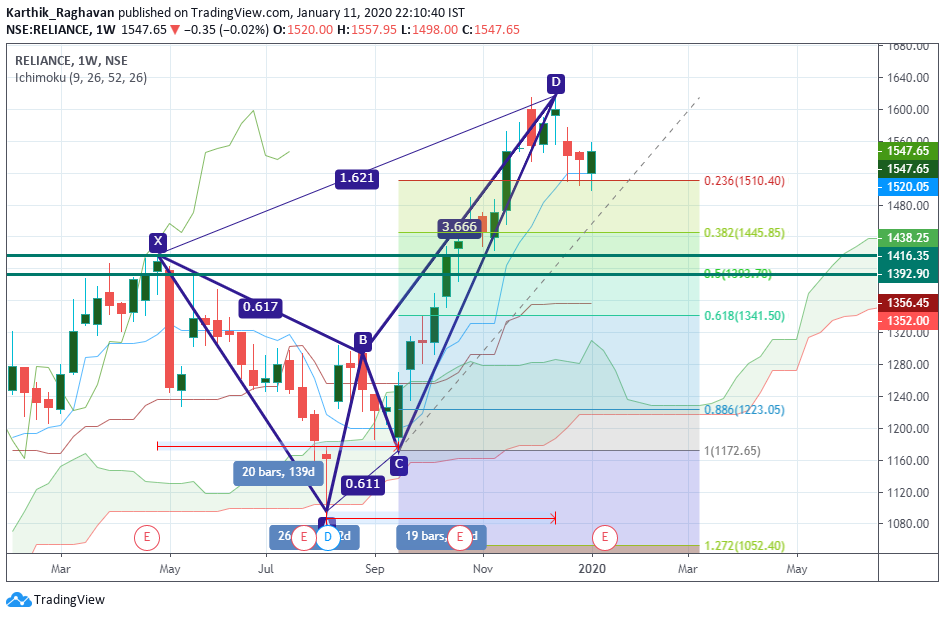
Reliance has formed a Harmonic Crab pattern and also has a similar pattern C Clamp pattern in the ichimoku. On a whole looks negative. —————————————————————————————–
Stock Ticker – NSE: RELIANCE – Reliance Industries Ltd. – ENERGY
Bearish Trade plan:
Entry Level 1522 Target 1416 Stoploss 1598
Analyst Rating – :3/5
View Posted on 2020-01-11
Reliance Looks Bearish on a Weekly chart
feel free to call us +919500077790 info@eqsis.com
Stock Analysis
M | T | W | T | F | S | S |
---|---|---|---|---|---|---|
1 | 2 | 3 | 4 | 5 | 6 | 7 |
8 | 9 | 10 | 11 | 12 | 13 | 14 |
15 | 16 | 17 | 18 | 19 | 20 | 21 |
22 | 23 | 24 | 25 | 26 | 27 | 28 |
29 | 30 |
Bullish View
Bearish View
- Bearish-GAP-SHORT-BICON-25-10-2019 October 25, 2019
- FEDERAL BANK – BEARISH ENGULFING October 17, 2019
- Cummins India – Bearish Engulfing – 24Sep19 September 25, 2019
- Day29-Tata Motors DVR – Bearish Piercing – 12Sep19 September 12, 2019
- Day27-Bearish-Engulfing pattern-Tech Mahindtra-09Sep19 September 10, 2019
How this forum help stock traders?
Stock Trading is business, the success depends not just on capital or subscribing advisory services or participating workshops. The factors such as your awareness level about business, Efforts and your contributions, Smartness, Knowledge in analysis and trading instrument, availability of infrastructure and emotional control determine your success.
Karthik please explain these Patterns in details