
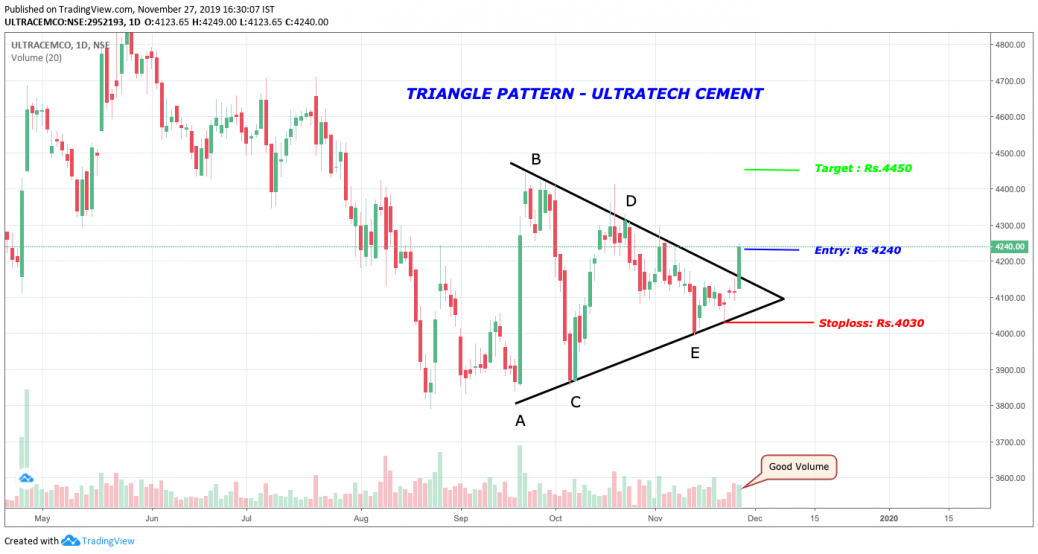
5 Wave pattern (A-B-C-D-E) formed a triangle shape in UltraTech Cement Ltd.
Duration: 2 Months.
The Bullish breakout happened on 27-Nov-2019 with good volume.
Long position can be initiated.
—————————————————————————————–
Stock Ticker – NSE: ULTRACEMCO – UltraTech Cement Ltd. – CEMENT
Bullish Trade plan:
Entry Level 4240 Target 4450 Stoploss 4030
Analyst Rating – :4/5
View Posted on 2019-11-27


Hi,
Good spot… When the upside breakout occurs, there should be an unusual volume to confirm the trend.
@naresh, Thanks for your comments. Yes, I agree with you. There should be an unusual volume. Anyway, I would like to monitor the trend and behaviour of this pattern.
Good one. Ultra tech cements is on sensex now, will be interesting to watch the price rally over the next few weeks
Yes. Thanks for your comments.
Good one Suresh
@naresh: when we say unusual volume, can we assume equivalent volume of point A? Reference of this kind would help.
@rajkumar-dhandapani Thanks for your comments.
@rajkumar-dhandapani Yes sir, that’s exactly what I meant
Thanks Naresh
The Price didn’t move as expected. Stop-loss Hit on 11-Dec-2019.