
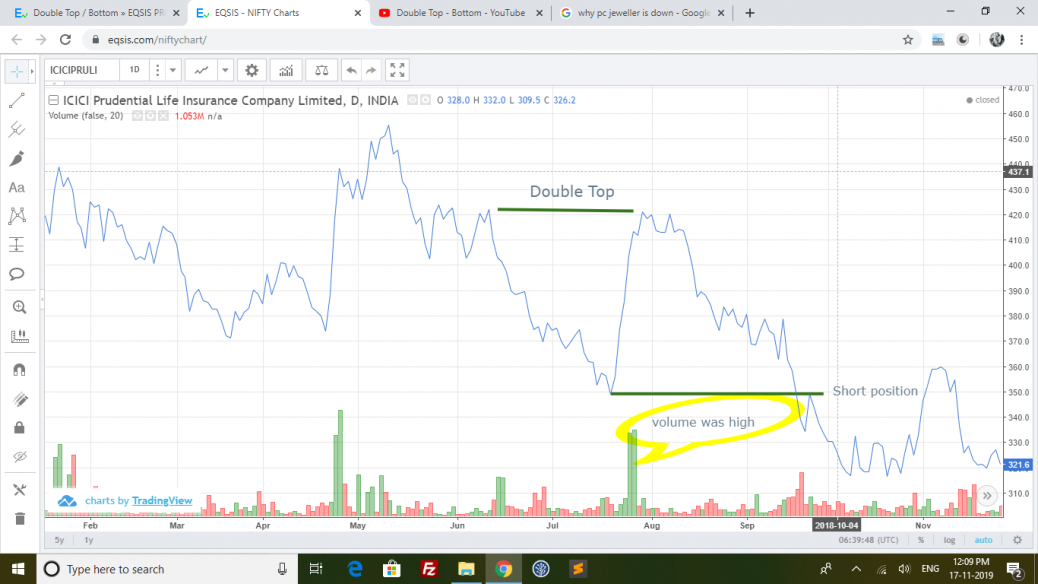
Found double top around the price of 421 during 12-6-2019 to 30-7-2019. Found high volume in second top.
feel free to call us +919500077790 info@eqsis.com
Found double top around the price of 421 during 12-6-2019 to 30-7-2019. Found high volume in second top.
| M | T | W | T | F | S | S |
|---|---|---|---|---|---|---|
| 1 | 2 | 3 | 4 | 5 | 6 | 7 |
| 8 | 9 | 10 | 11 | 12 | 13 | 14 |
| 15 | 16 | 17 | 18 | 19 | 20 | 21 |
| 22 | 23 | 24 | 25 | 26 | 27 | 28 |
| 29 | 30 | |||||
 Bearish-GAP-SHORT-BICON-25-10-2019 October 25, 2019
 FEDERAL BANK – BEARISH ENGULFING October 17, 2019
 Cummins India – Bearish Engulfing – 24Sep19 September 25, 2019
 Day29-Tata Motors DVR – Bearish Piercing – 12Sep19 September 12, 2019
 Day27-Bearish-Engulfing pattern-Tech Mahindtra-09Sep19 September 10, 2019
Stock Trading is business, the success depends not just on capital or subscribing advisory services or participating workshops. The factors such as your awareness level about business, Efforts and your contributions, Smartness, Knowledge in analysis and trading instrument, availability of infrastructure and emotional control determine your success.
EQSIS, A Stock Market Research Firm
Knowledge is Power. Here you may start from basics, get support while practicing and evolve as active analyst, later you can become a pro


Hi,
The Double top pattern is a reversal trading pattern that signals the end of a bullish trend and the start of a new bearish trend. Moreover, the double top appears at the end of an uptrend… In the above chart, the top A is not qualified because the prior trend seems like a range-bound market… To qualify as a reversal pattern, there must be a prior trend to reverse. Additionally, The Double top has a minimum duration of 20 days and it rarely exceeds 3 or 4 months long. Anything less than 20 days of duration doesn’t act as a double top pattern.
please find the attached screenshot for your reference