
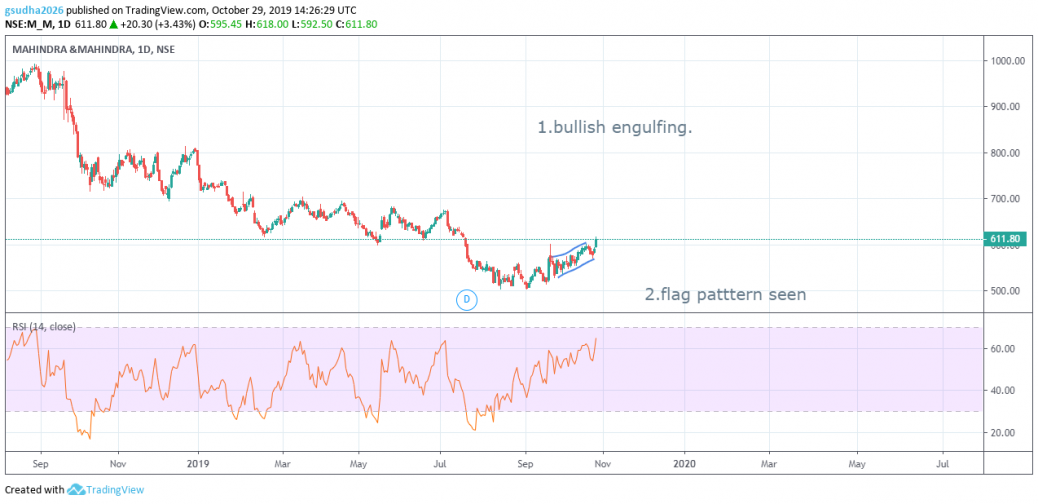
1.SEEN FLAG PATTERN.
2.BULLISH ENGULFING CANDLES.
please view and write your comments.
—————————————————————————————–
Stock Ticker – NSE: M&M – Mahindra & Mahindra Ltd. – AUTOMOBILE
Bullish Trade plan:
Entry Level 610 Target 636 Stoploss 571
Analyst Rating – :3/5
View Posted on 2019-10-29


Hi,
It’s not a flag pattern. Conditions for flag not satisfied..steeper pole is not formed,and there is no breakout…For flag pattern we need to check the volume… please check the volume ..
@donson
Agree with your comments.
Also the bullish engulfing is not visible.
Refer the mentioned chart..
@donson
Your reference chart is clear and good. Thanks.
I finished my 25days of activity..now should I need to do..shall I start my trading..
Thanks for your feedback.Really appreciated.
Hi,
Identifying the flag pattern is an easy job if you have the right trading conditions.
Now is the time to go through the flag chart pattern strategy step-by-step conditions for the bearish flag pattern or Inverted flag pattern
A bearish flag pattern forms when the price falls sharply, then moves sideways. This sideways movement can be considered as flag and volume should be low during the sideway movement meanwhile volume should be high during the breakout day.
Don’t consider single day steeper pole
The duration of the sideways movement of the flag cloth is 4-7 days.
Trade Plan for bearish flag pattern-
Your entry should be just below the breakouts of the consolidation
Set a stop loss just above the flag formation
Your target should be based on the height of the flag
Refer the below screenshot