
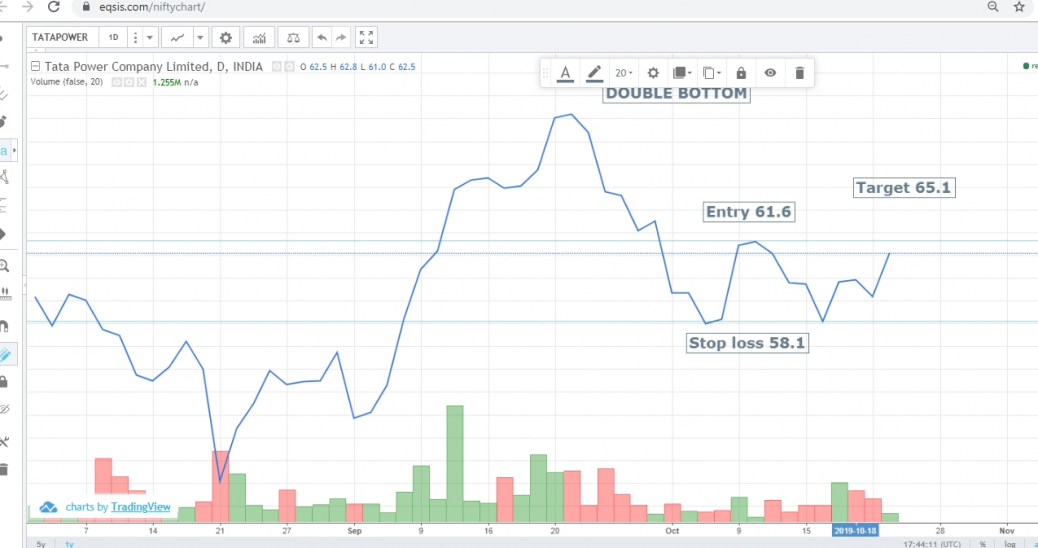
Tata Power forming a double bottom
—————————————————————————————–
Stock Ticker – NSE: TATAPOWER – Tata Power Co. Ltd. – ENERGY
Bullish Trade plan:
Entry Level 61.6 Target 65.1 Stoploss 58.1
Analyst Rating – :3/5
View Posted on 2019-10-23
feel free to call us +919500077790 info@eqsis.com
Tata Power forming a double bottom
—————————————————————————————–
Stock Ticker – NSE: TATAPOWER – Tata Power Co. Ltd. – ENERGY
Bullish Trade plan:
Entry Level 61.6 Target 65.1 Stoploss 58.1
Analyst Rating – :3/5
View Posted on 2019-10-23
| M | T | W | T | F | S | S |
|---|---|---|---|---|---|---|
| 1 | 2 | 3 | 4 | 5 | 6 | 7 |
| 8 | 9 | 10 | 11 | 12 | 13 | 14 |
| 15 | 16 | 17 | 18 | 19 | 20 | 21 |
| 22 | 23 | 24 | 25 | 26 | 27 | 28 |
| 29 | 30 | |||||
 Bearish-GAP-SHORT-BICON-25-10-2019 October 25, 2019
 FEDERAL BANK – BEARISH ENGULFING October 17, 2019
 Cummins India – Bearish Engulfing – 24Sep19 September 25, 2019
 Day29-Tata Motors DVR – Bearish Piercing – 12Sep19 September 12, 2019
 Day27-Bearish-Engulfing pattern-Tech Mahindtra-09Sep19 September 10, 2019
Stock Trading is business, the success depends not just on capital or subscribing advisory services or participating workshops. The factors such as your awareness level about business, Efforts and your contributions, Smartness, Knowledge in analysis and trading instrument, availability of infrastructure and emotional control determine your success.
EQSIS, A Stock Market Research Firm
Knowledge is Power. Here you may start from basics, get support while practicing and evolve as active analyst, later you can become a pro


Hi,
The duration between the two bottoms should be at least one month.
It may vary from a few weeks to many months but generally, it takes 1-3 months.
ok thanks
And also volume should be increasing after the second bottom to indicate bullish