
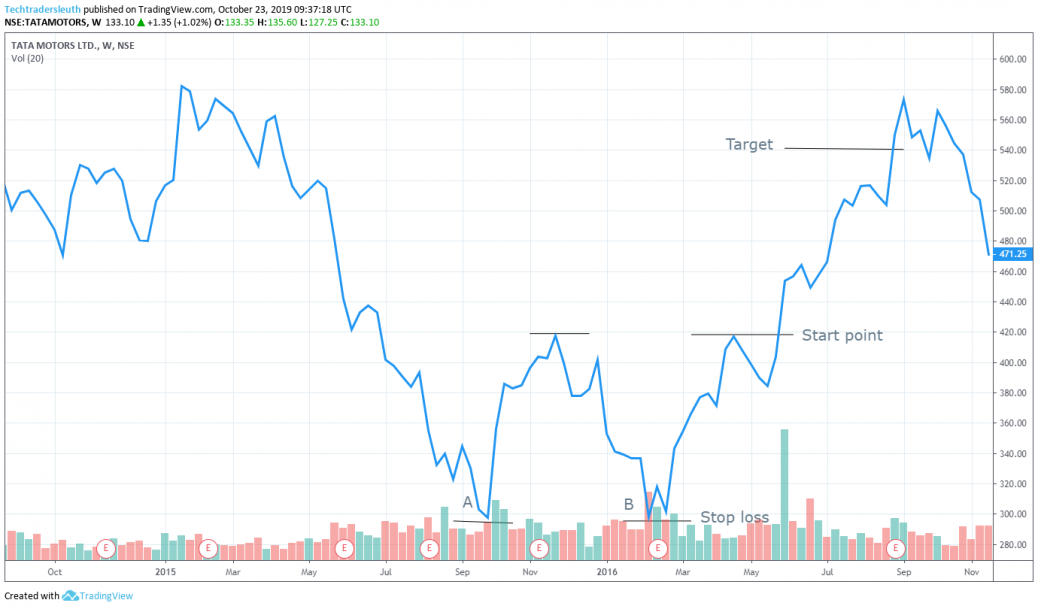
A double bottom pattern has been seen on TATA MOTORS chart, between september 2015 and march of the next year. The volume at point B as well as point C is high. The minimum duration of 20 days between the two bottoms is satisfied. Thereby long positions can be considered and therefore the start price is 420, finally the stop loss is point B, Whereas The target is 540. the target has been achieved in july 2016.


Good analysis sir.
Thank you!!! Looking forward to see new posts from you too!!!
Hi,
Good analysis sir….. keep doing this