
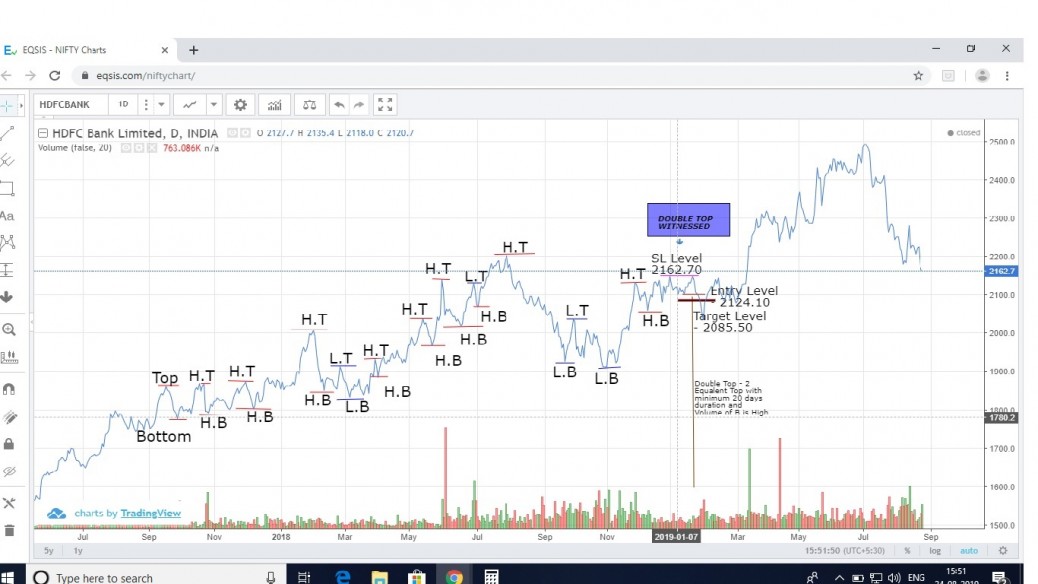
Double Top was witnessed on 21-Jan-2019 in HDFC Bank Ltd script with Entry Point at 2124.10 Target is 2085.50 and SL 2162.70 with risk of 38.60. Target was 24-Jan-2019.
feel free to call us +919500077790 info@eqsis.com
Double Top was witnessed on 21-Jan-2019 in HDFC Bank Ltd script with Entry Point at 2124.10 Target is 2085.50 and SL 2162.70 with risk of 38.60. Target was 24-Jan-2019.
| M | T | W | T | F | S | S |
|---|---|---|---|---|---|---|
| 1 | 2 | 3 | 4 | 5 | 6 | 7 |
| 8 | 9 | 10 | 11 | 12 | 13 | 14 |
| 15 | 16 | 17 | 18 | 19 | 20 | 21 |
| 22 | 23 | 24 | 25 | 26 | 27 | 28 |
| 29 | 30 | |||||
 Bearish-GAP-SHORT-BICON-25-10-2019 October 25, 2019
 FEDERAL BANK – BEARISH ENGULFING October 17, 2019
 Cummins India – Bearish Engulfing – 24Sep19 September 25, 2019
 Day29-Tata Motors DVR – Bearish Piercing – 12Sep19 September 12, 2019
 Day27-Bearish-Engulfing pattern-Tech Mahindtra-09Sep19 September 10, 2019
Stock Trading is business, the success depends not just on capital or subscribing advisory services or participating workshops. The factors such as your awareness level about business, Efforts and your contributions, Smartness, Knowledge in analysis and trading instrument, availability of infrastructure and emotional control determine your success.
EQSIS, A Stock Market Research Firm
Knowledge is Power. Here you may start from basics, get support while practicing and evolve as active analyst, later you can become a pro


Hi,
Conditions were not met…….. Try to find more accurate double top patterns. Refer the attachment screenshot or else Please refer training handout book
The double top has two same highs Or it looks like an “M” shape. Since the stock is unable to make a higher high, this tells us that the bulls are getting tired. The bears may be coming in to drag the stock lower. The Double top has a minimum duration of 20 days and it rarely exceeds 3 or 4 months long. Anything less than 20 days of duration doesn’t act as a double top pattern.
Thanks Naresh, I have analaysis other 2 charts today. One is Old and one is in current market analysis. Please check and advise.