
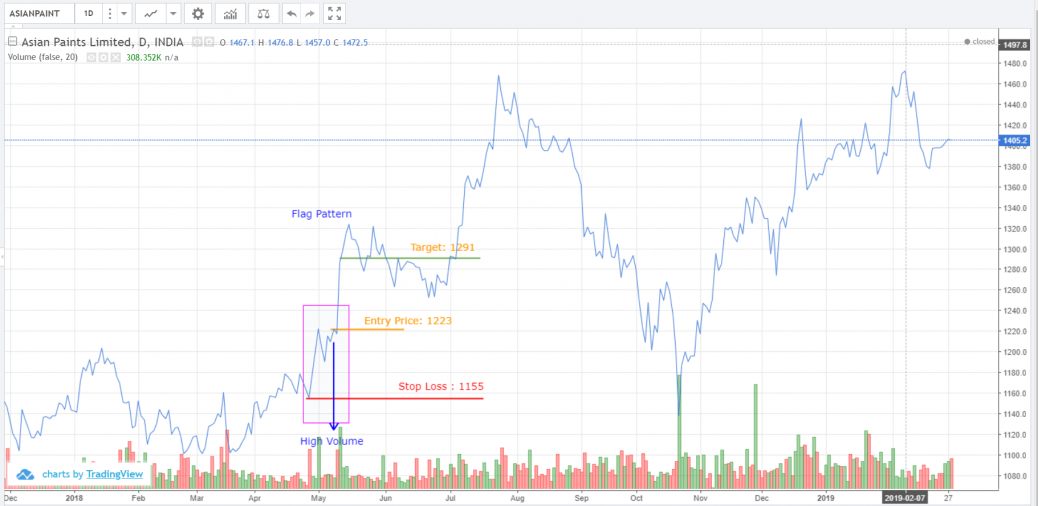
Flag pattern is formed with steeper pole formation from a price of 1155 and sideways at 1223 breaking out post this level. This has happened within a duration of 10 days with high volume during breakout above 1223
This has achieved the target of 1291 in 3 days.


Hi,
Click the below link for more information about flat pattern
https://www.youtube.com/watch?v=yAoFC8hSYic
Hi sir,Candlestick charts can be better for flag analysis.
Thanks Kalyan, will ues the suggestion in my analysis