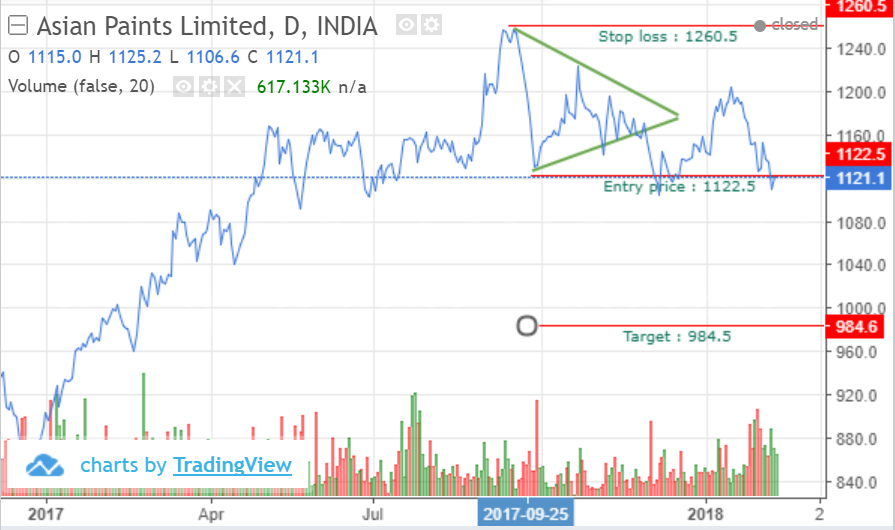
Asian paints formed a triangle pattern. The triangle formed between 18-Sep-2017 to 28-Nov-2017. The volume is less during the triangle formation indicating consolidation and it broke out on the bearish side. We can take a short position. The entry price is 1122.5 and the stop loss is 1260.5. It crossed the entry price on 04-12-2017. The risk here is 138 (1260.5 – 1122.5). The target price should be 984.5 (1122.5 – 138). It has neither achieved target nor triggered stop loss yet.
Triangle Bearish Breakout – Asian paints
feel free to call us +919500077790 info@eqsis.com
Stock Analysis
M | T | W | T | F | S | S |
---|---|---|---|---|---|---|
1 | 2 | 3 | 4 | 5 | 6 | 7 |
8 | 9 | 10 | 11 | 12 | 13 | 14 |
15 | 16 | 17 | 18 | 19 | 20 | 21 |
22 | 23 | 24 | 25 | 26 | 27 | 28 |
29 | 30 |
Bullish View
Bearish View
- Bearish-GAP-SHORT-BICON-25-10-2019 October 25, 2019
- FEDERAL BANK – BEARISH ENGULFING October 17, 2019
- Cummins India – Bearish Engulfing – 24Sep19 September 25, 2019
- Day29-Tata Motors DVR – Bearish Piercing – 12Sep19 September 12, 2019
- Day27-Bearish-Engulfing pattern-Tech Mahindtra-09Sep19 September 10, 2019
How this forum help stock traders?
Stock Trading is business, the success depends not just on capital or subscribing advisory services or participating workshops. The factors such as your awareness level about business, Efforts and your contributions, Smartness, Knowledge in analysis and trading instrument, availability of infrastructure and emotional control determine your success.
Hi sir,
your work is good.