
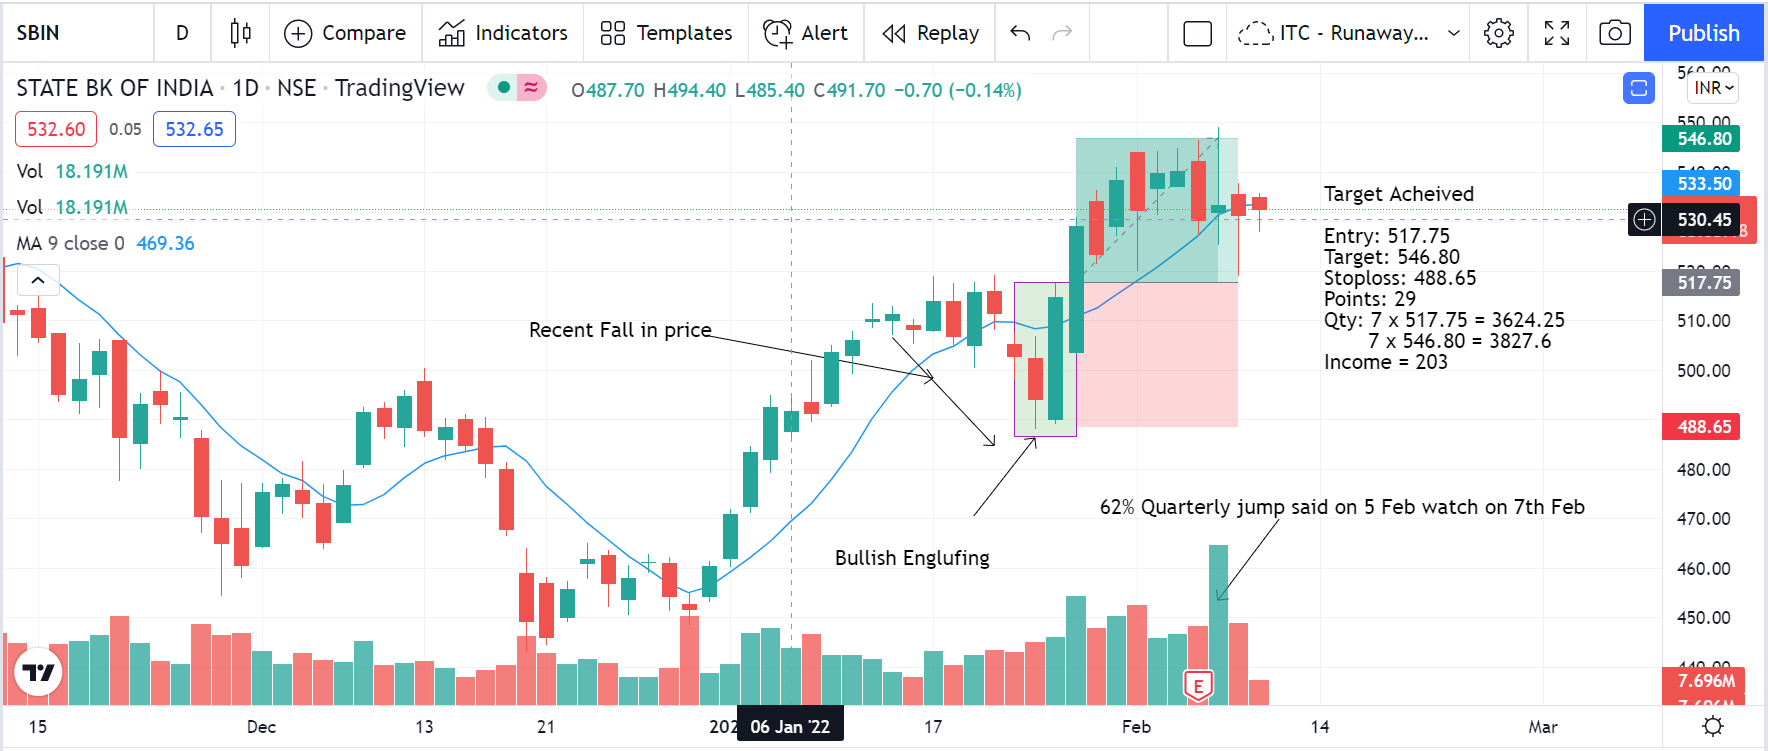
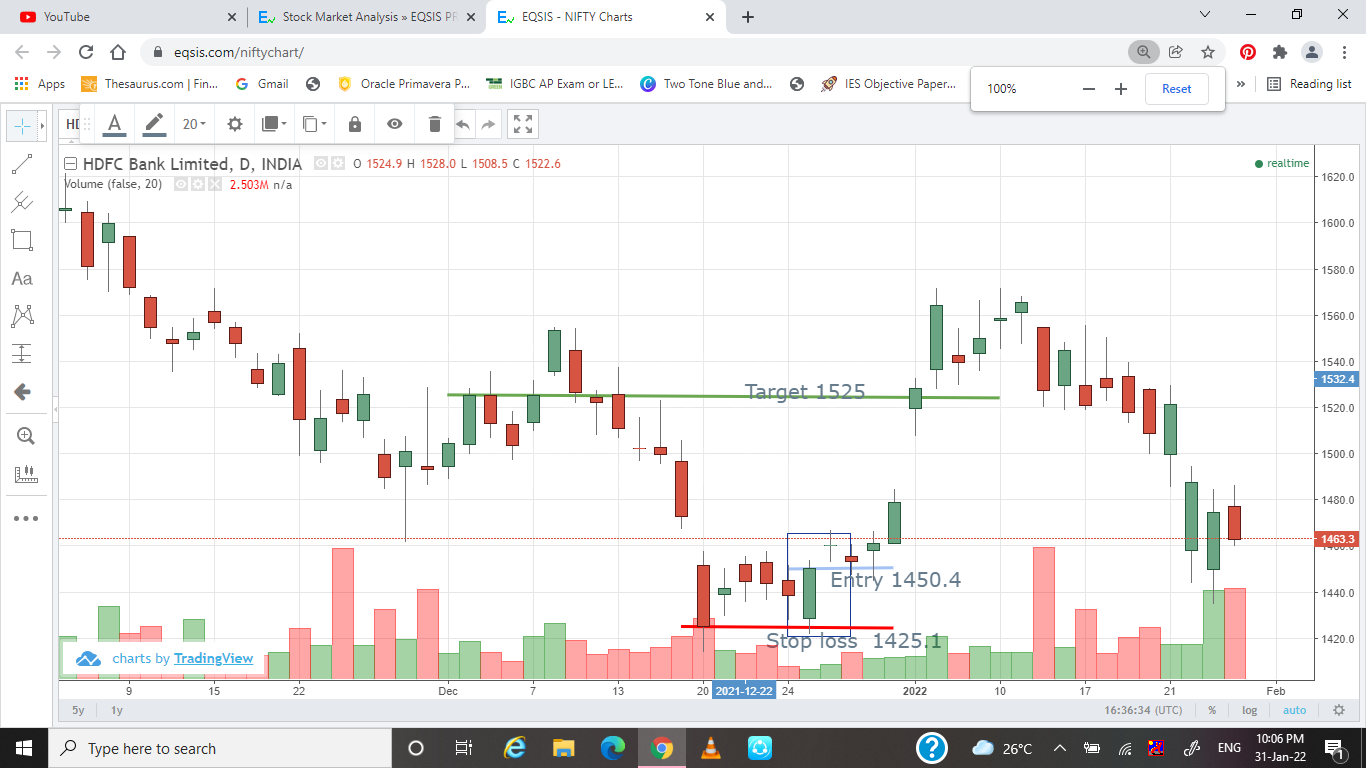
Target was achieved once the recent fall in price saw a bullish englufing and a increase of 29 points...
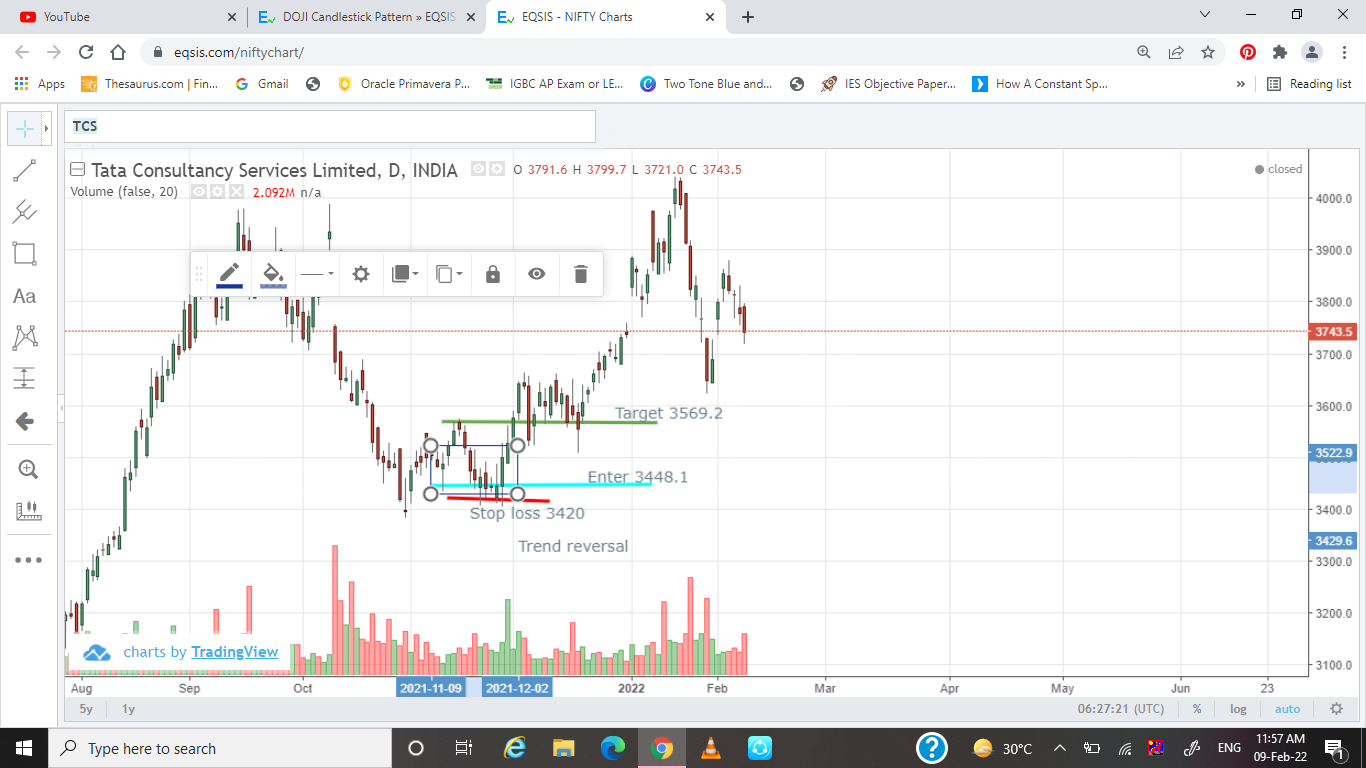
A doji pattern was observed in TCS with a trend reversal. The doji pattern was followed by high volume....
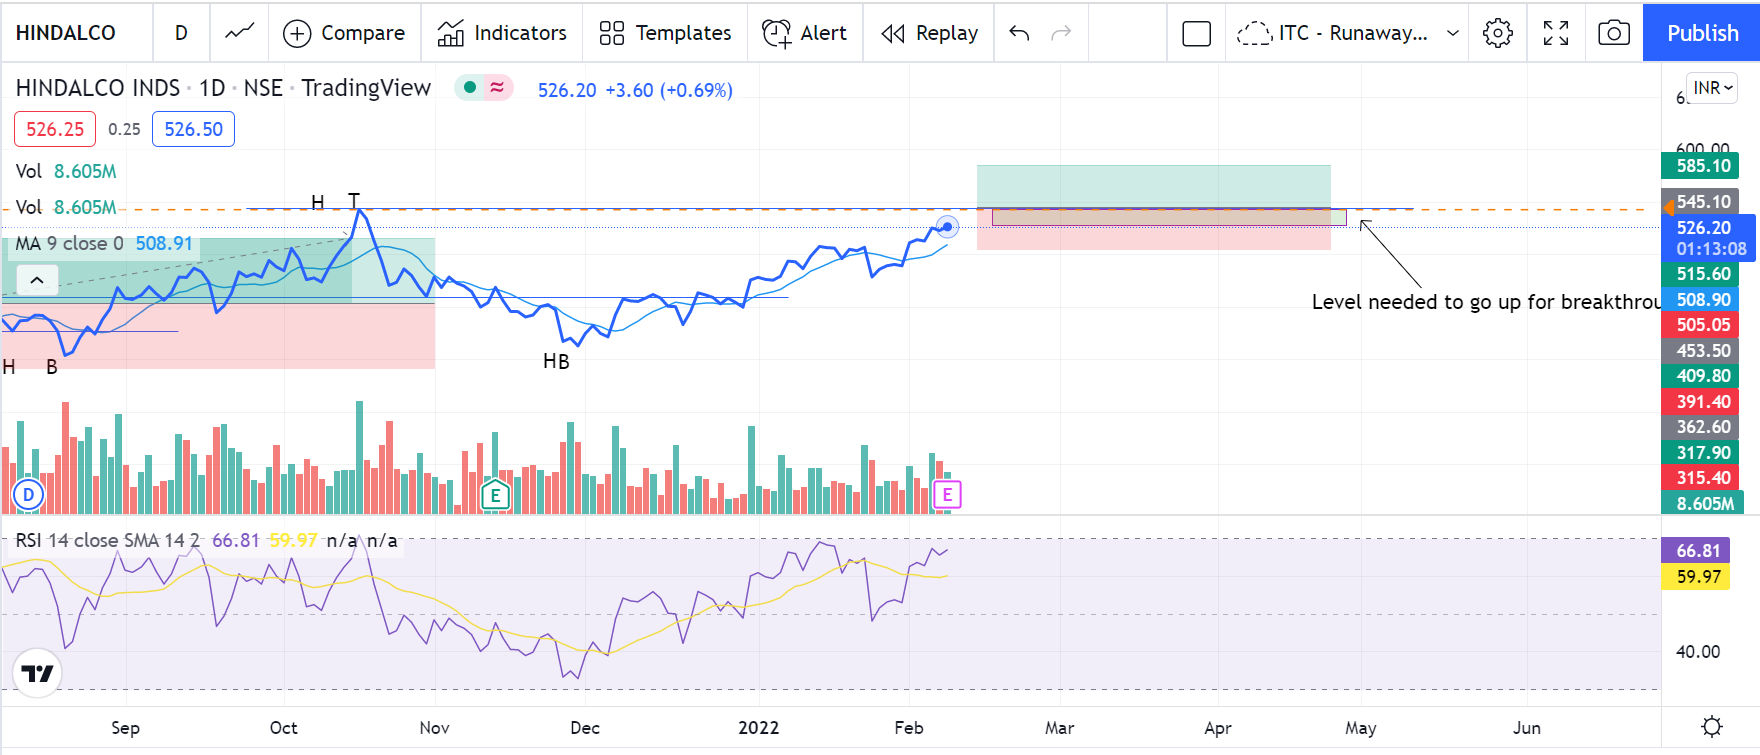
Have tracked Hindalco in 2 years’ charts and have seen it satisfy the bullish condition for Dow theory of...
Technical Indicators for Short Term Trading
his is mathematical way of identifying the trend in the market using algorithmic patterns. Its is just a supportive...
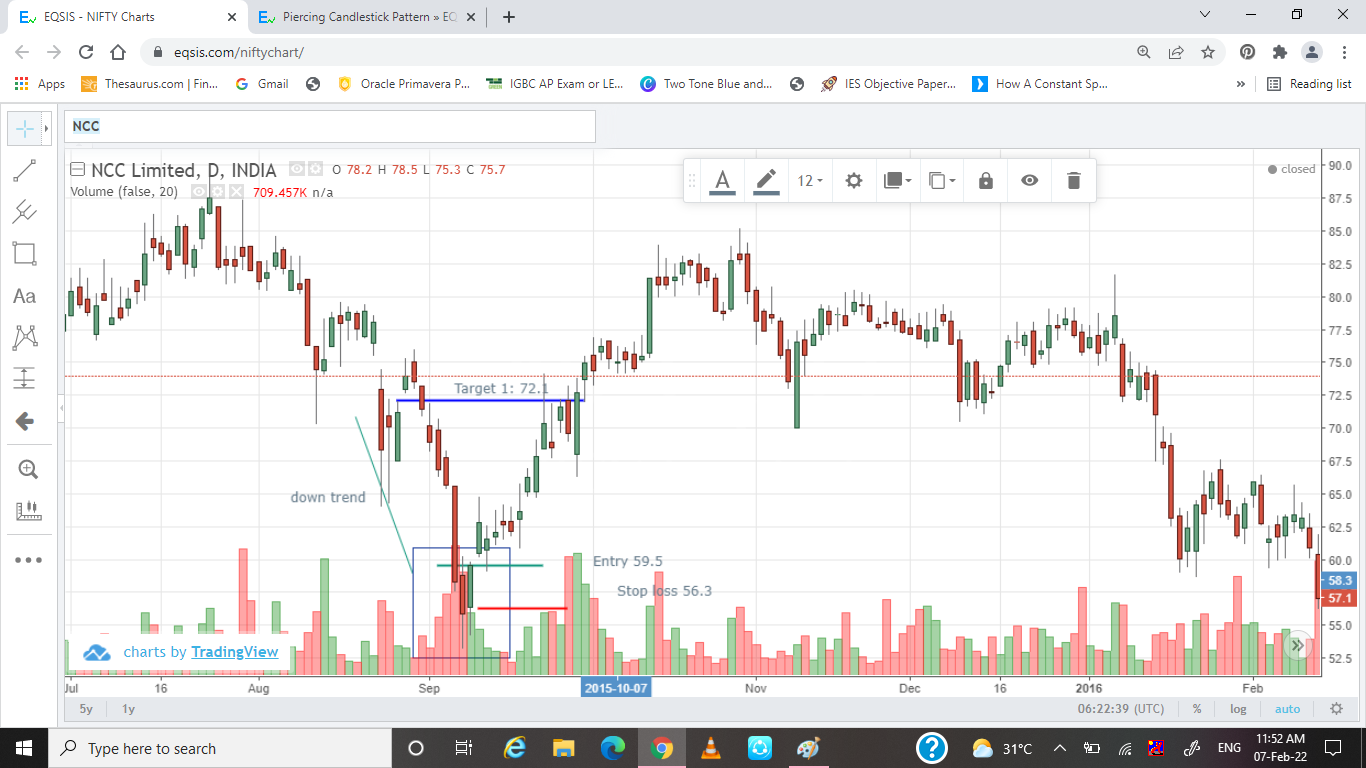
A downtrend was noticed with a bearish candle covering the previous trend almost above 50% with a short upper...
A steady fall in price was witnessed which clearly indicated a bearish candle trend. The bullish candle engulfed the...
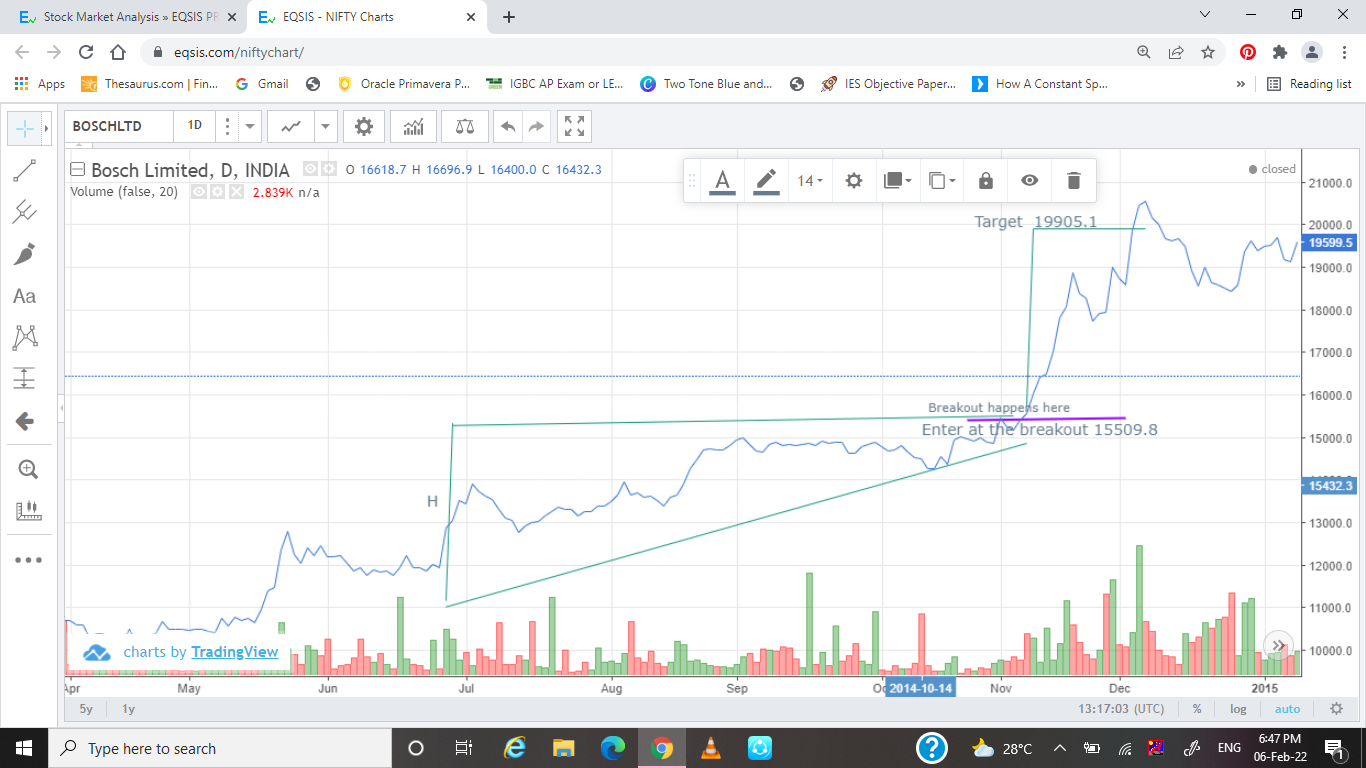
A triangle pattern was witnessed in Bosch. The support and resistance level is shown in the figure. A breakout...
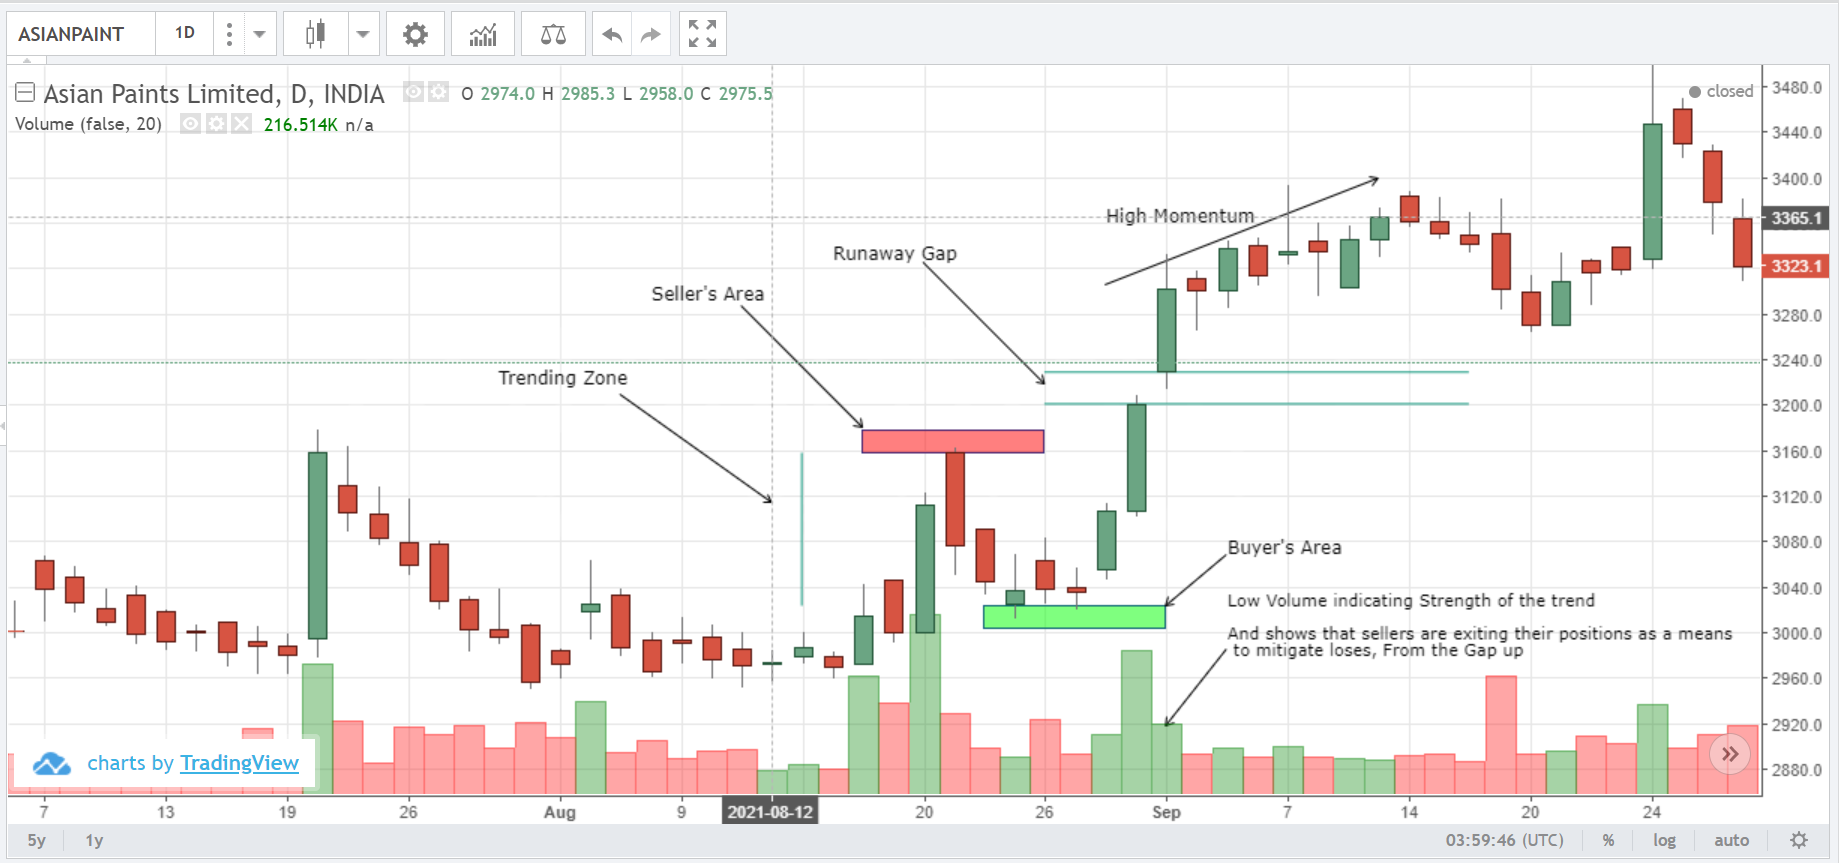
The Runaway Gap was with low volume indicating the strength of the trend and that sellers are trying to...
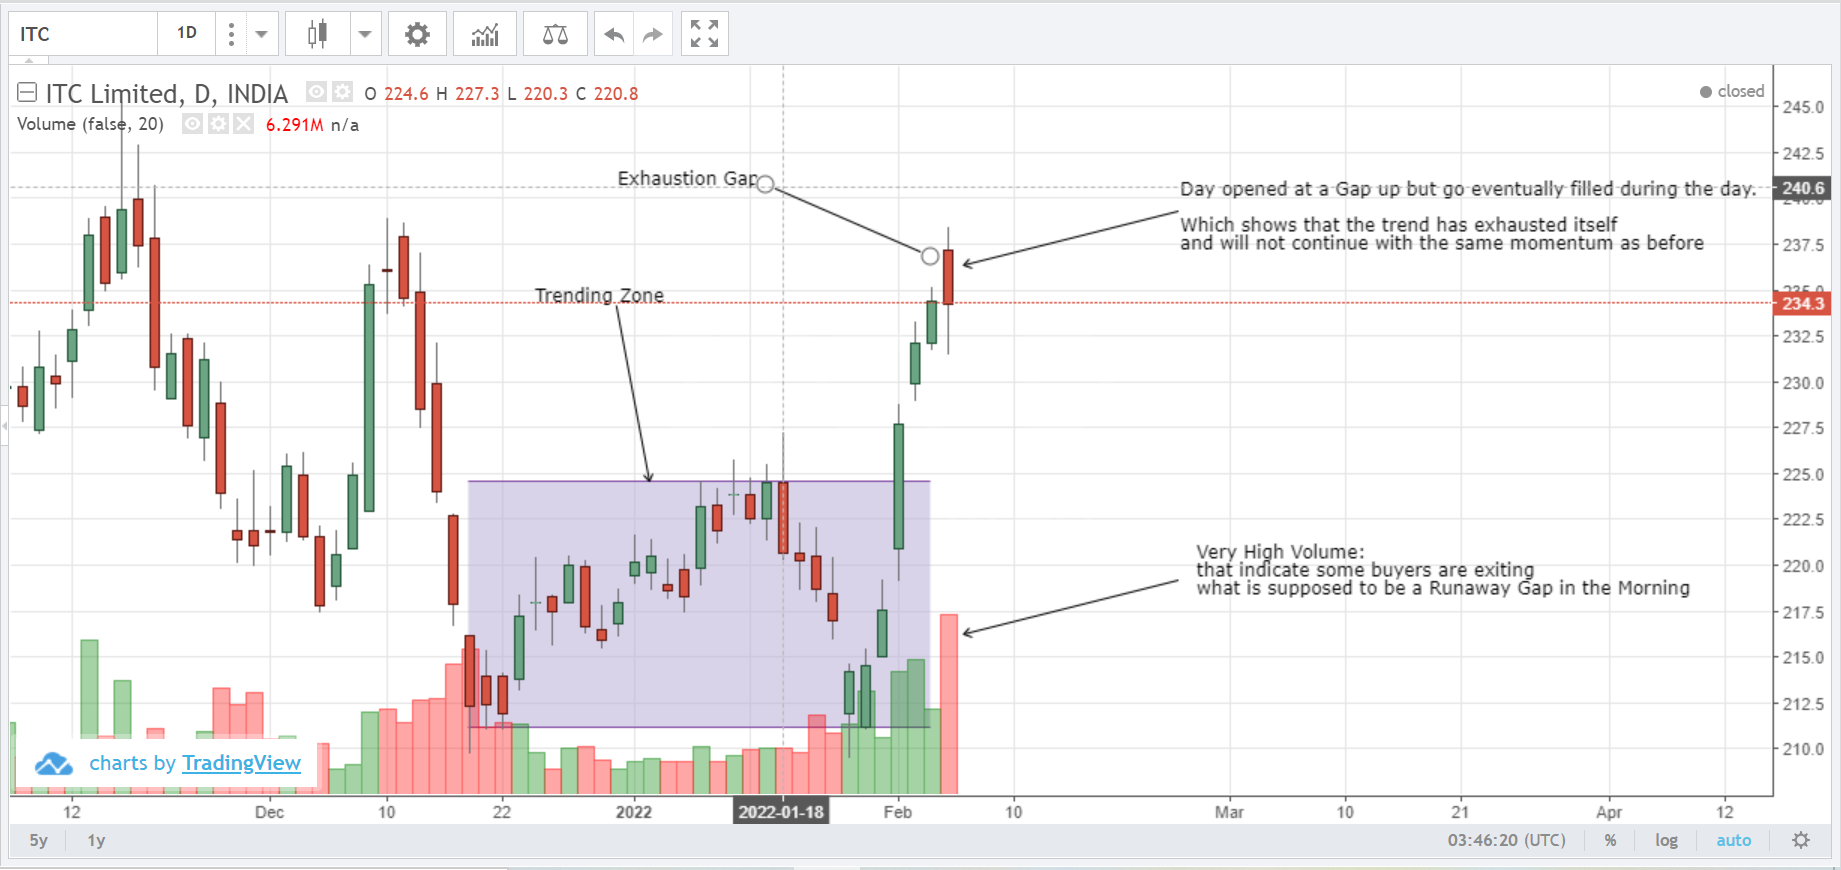
The open on 4th Feb opened up with a Gap up way beyond trending zone. Later on in the...
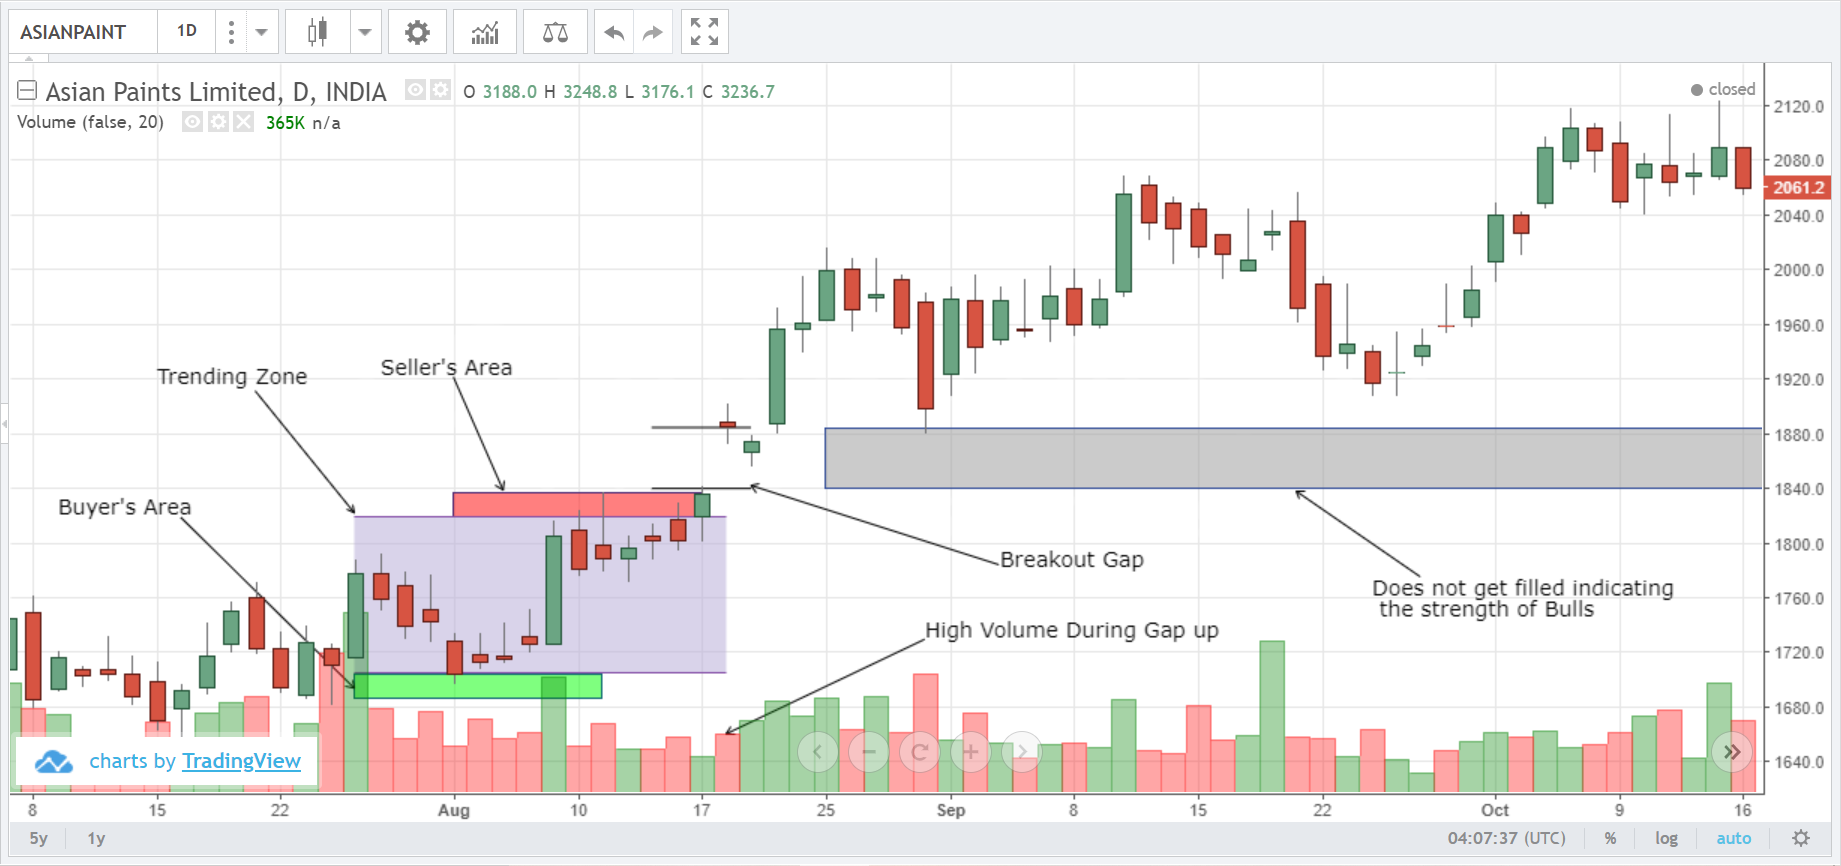
This breakout Gap happens beyond the trending zone and it does not get filled except the doji that appear...
Recently Active Members
Bullish View


Bearish View
-
 Bearish-GAP-SHORT-BICON-25-10-2019 October 25, 2019
-
 FEDERAL BANK – BEARISH ENGULFING October 17, 2019
-
 Cummins India – Bearish Engulfing – 24Sep19 September 25, 2019
-
 Day29-Tata Motors DVR – Bearish Piercing – 12Sep19 September 12, 2019
-
 Day27-Bearish-Engulfing pattern-Tech Mahindtra-09Sep19 September 10, 2019