
PL. SEE BELOW
Analysis enables you to understand the market better. The are two types of analysis. a) Fundamental analysis and b)...
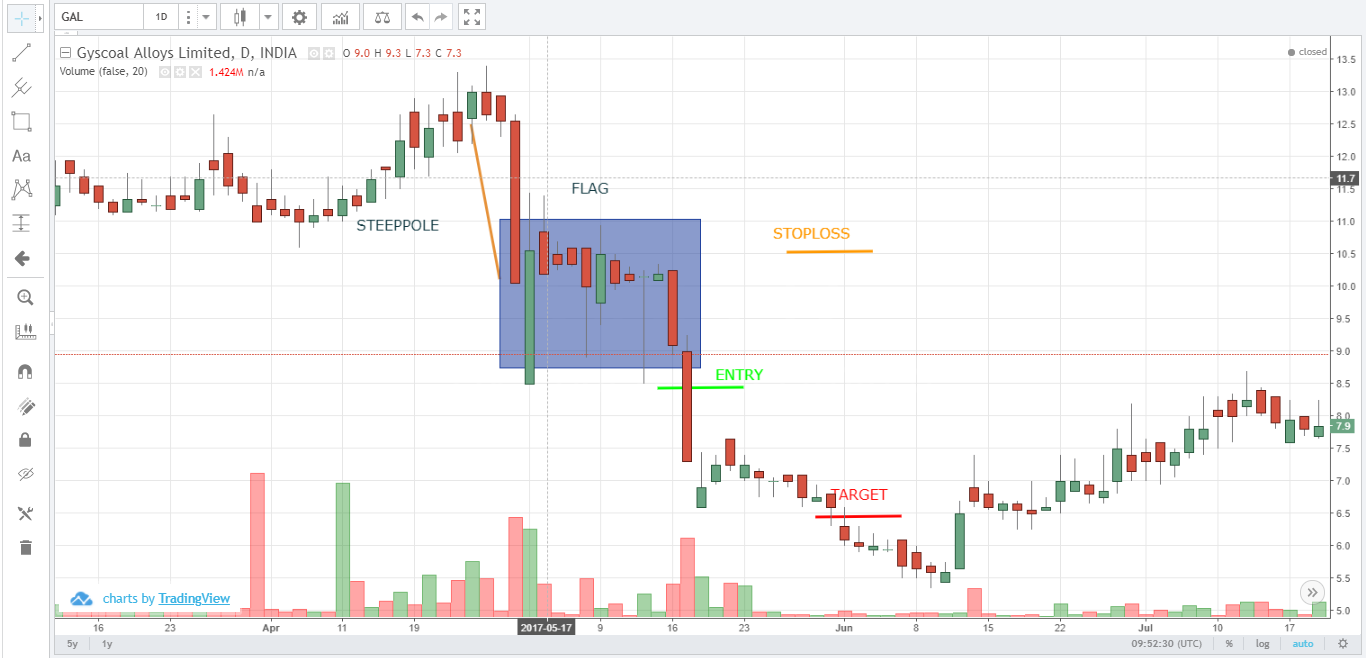
STEEP POLE FORMED IN 3 DAYS. GOOD FLAG FORMED IN NEARLY 8 DAYS. DURING THE BREAK CONSIDERABLY GOOD VOLUME...
THE SLOPE IS STEEP ENOUGH. THE FLAG IS GOOD AND FORMED IN 7DAYS. DURING THE BREAKOUT THE VOLUME IS...
Day-6 -Understanding Price patterns
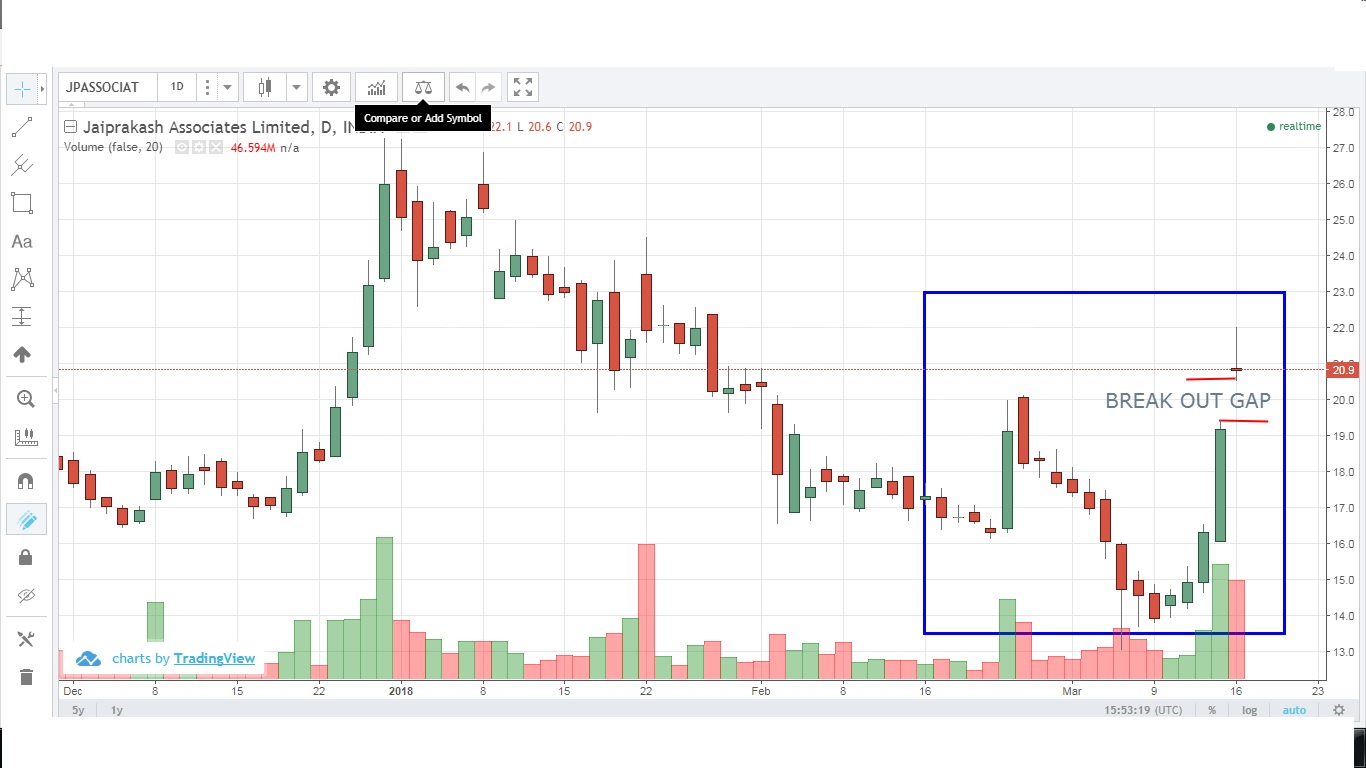
Price pattern is a recognizable configuration of price movement that is identified using a series of trendlines and/or curves....
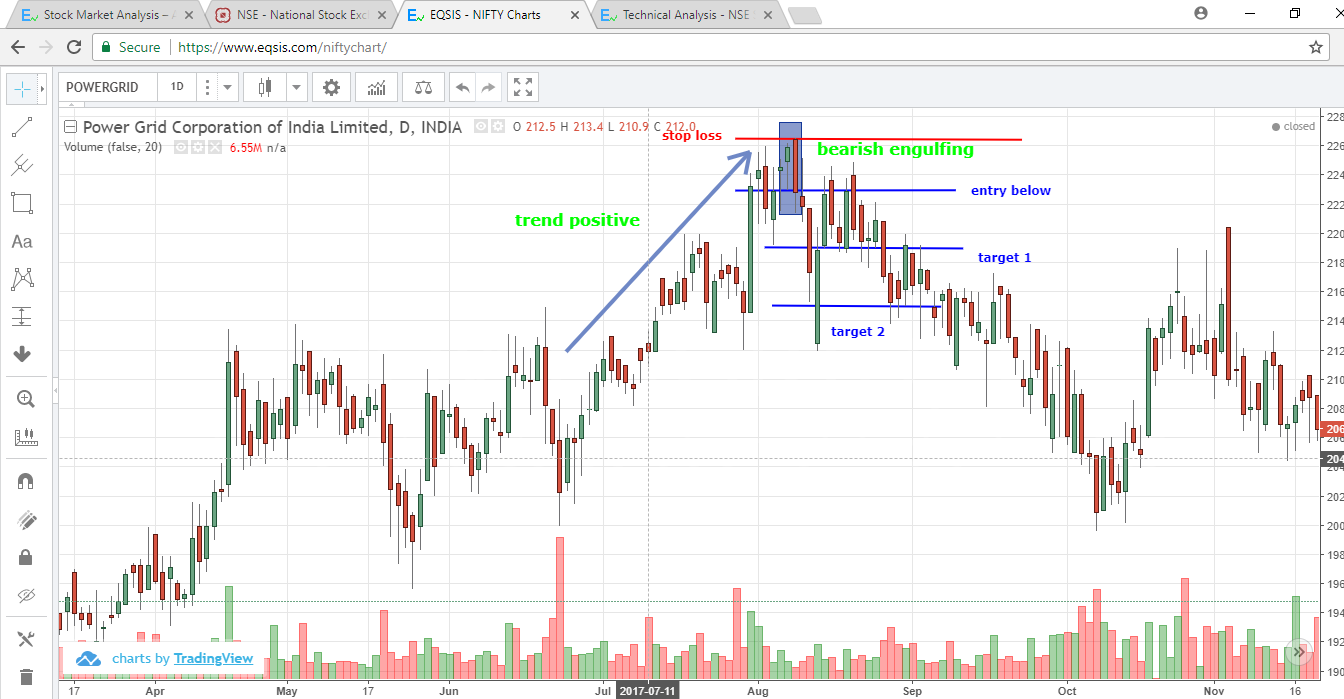
sell below 223 stop loss will be 226 and target 219 and 215
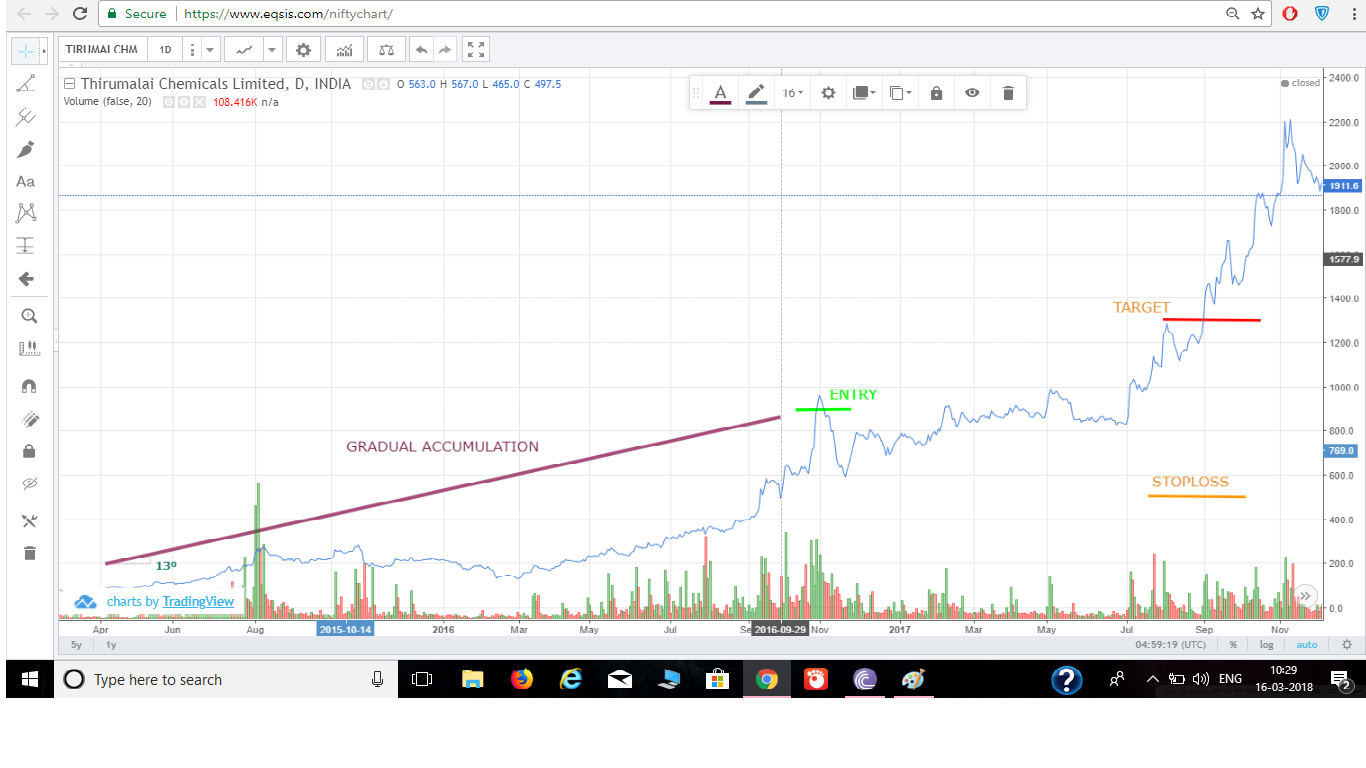
GRADUAL ACCUMULATION FOR NEARLY 2 YEARS. SUDDEN HIKE IN THE PRICE 900. HOLD LONG POSISTION THERE. ENTRY=900 EXIT=1300 STOPLOSS=500
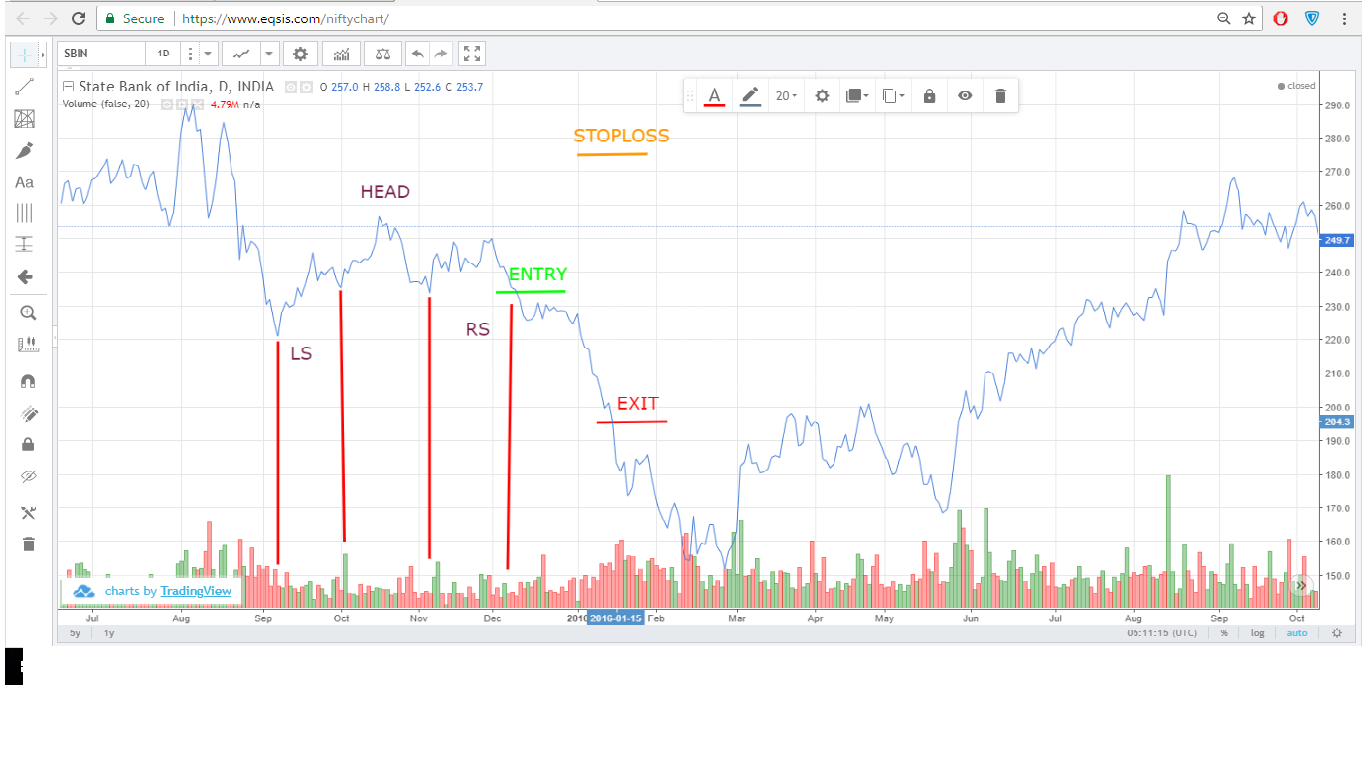
HEAD AND SHOULDER PATTERN FORMED WITH A GOOD TIME LINE OF 3 MONTHS. VOLUME IS COMPARATIVELY HIGH IN THE...
Recently Active Members
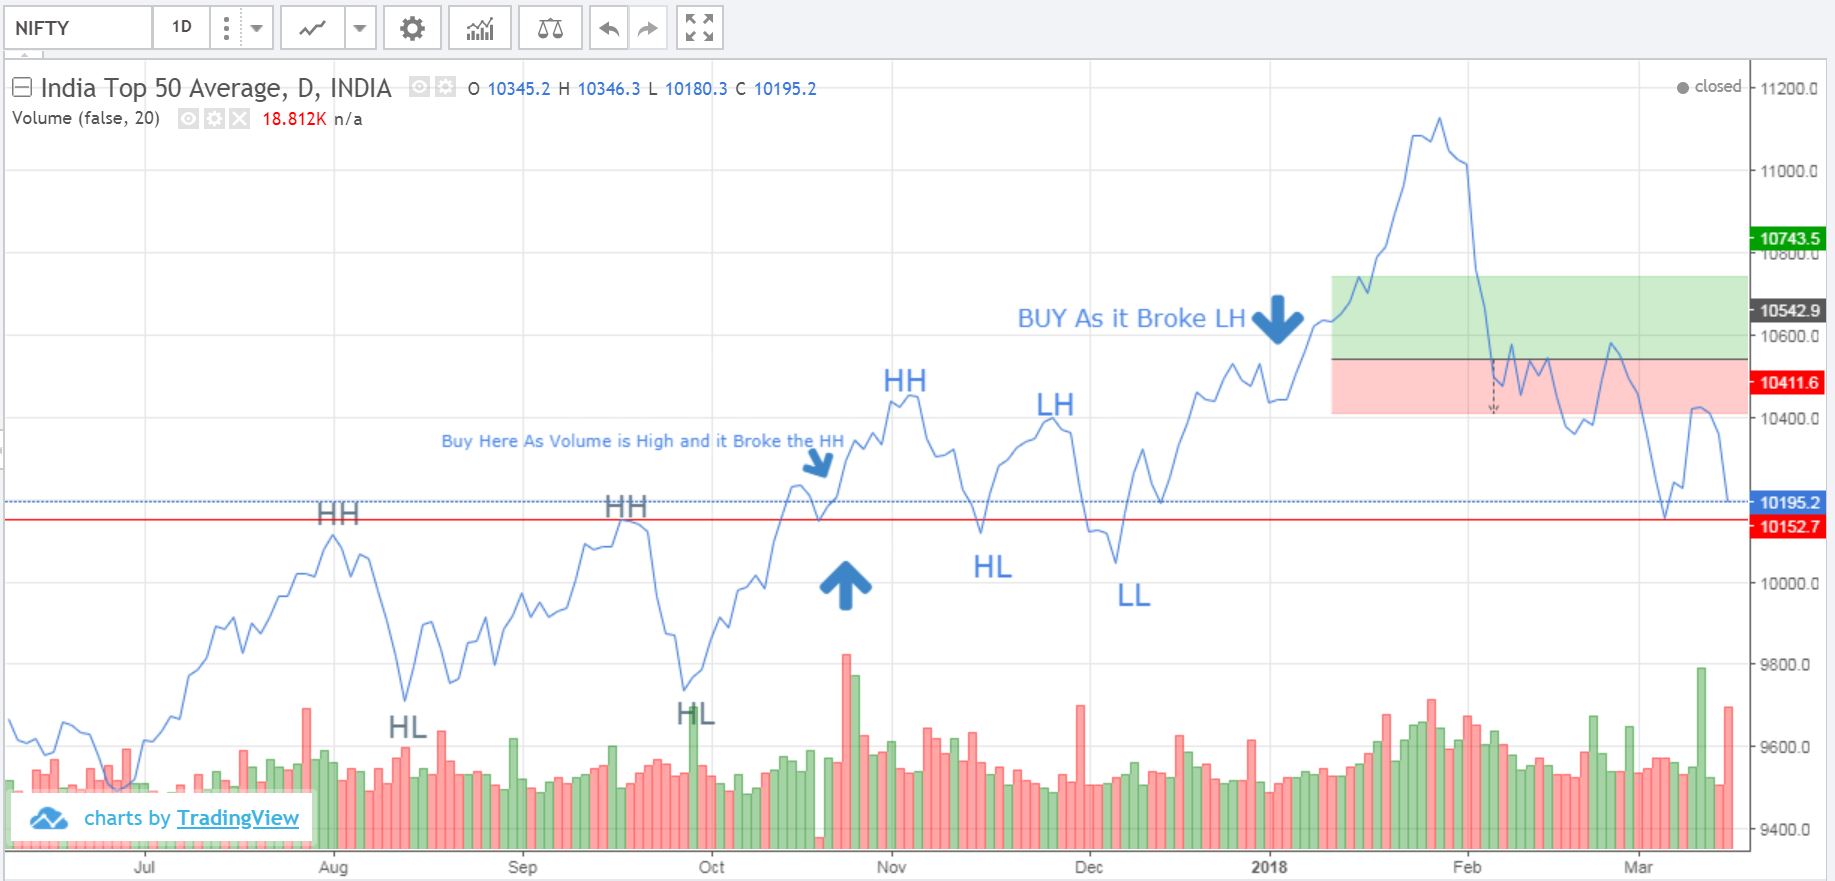
Bullish View


Bearish View
-
 Bearish-GAP-SHORT-BICON-25-10-2019 October 25, 2019
-
 FEDERAL BANK – BEARISH ENGULFING October 17, 2019
-
 Cummins India – Bearish Engulfing – 24Sep19 September 25, 2019
-
 Day29-Tata Motors DVR – Bearish Piercing – 12Sep19 September 12, 2019
-
 Day27-Bearish-Engulfing pattern-Tech Mahindtra-09Sep19 September 10, 2019